Google BigQuery: Copying data between projects and locations

I’ve worked on a tool called Big Replicate that we’ve open-sourced: it helps copy, and synchronise, data between different datasets in projects in Google BigQuery.

I’m a huge fan of Google’s BigQuery product: a large-scale, and affordable, hosted data-warehouse.

Data is stored in Tables, with sets of tables stored within a Dataset (all of which are part of a Google Cloud Project). Datasets can be stored in a number of different locations: the US, EU and Asia.

We use BigQuery most often with our Google Analytics data. Google provide a daily export of all hit data as part of their paid-for version of the product. But this data is automatically placed in a Dataset based in the US. If we want to connect it to our CRM data, for instance, that’s hosted within the EU then we need to copy data into the EU also.

We’ve written a tool that automatically synchronises data from one dataset into another. It works in such a way that it’s possible to copy data between both datasets within the same project, or datasets in entirely different projects. Further, datasets can be in different locations (allowing data to be copied from the US to the EU, for instance).

The code is available on GitHub: https://github.com/uswitch/big-replicate, with binaries also available.

For example, to synchronise any Google Analytics session tables:

The tool will find all tables that exist in the source dataset and not yet in the destination dataset, orders them lexicographically in reverse order by name (so table foo_20160712 is prioritised before foo_20160711). The top --number tables are copied. We use this to help migrate very large datasets over time, where we generally only need the more recent data immediately.

Multiplexing work reliably and efficiently with state machines and core.async

This all started with a tweet and brief exchange with a friend and ex-colleague:

This post describes some work we did recently that I’m pretty happy with: we model the execution of independent pieces of work as state machines which are executed concurrently by multiple core.async processes with state communicated over channels. 

Modeling with state machines helps flatten call chain complexity and makes retrying/recovering from error states trivial: we just try to apply the same transition to the same state again.

In short, we've improved both throughput and reliability.

Context

Specifically our problem was:

  1. Connect to a reporting API and download a report
  2. Transform the report, converting some values between units, currencies etc.
  3. Write the report out to S3 (ultimately to be ingested into our Redshift cluster)

It’s a pretty simple problem but when we’re downloading thousands of reports every day its likely that we’ll come across intermittent problems; mostly network errors connecting to the APIs or we’ll be rate throttled etc.

We started simple, making the most of the environment our system ran in.

Our original code was similar to this:

The reporting API lets us download aggregate information for a day and client.

Ensuring processes completed was the responsibility of a supervisor process. Although this was beautifully simple for the incremental work it was incredibly inefficient when running large imports:

  1. Our unit of work was all steps needed to download, process and upload a report. If any step failed we could only retry the whole.
  2. Even worse, if we were processing hundreds or thousands of reports together any failure would terminate and prevent all subsequent reports. We could unpick progress and change some command-line options to avoid doing too much again but it's painful.
  3. Handling errors was slow and painful. If our download request was rate limited we'd have to back-off; operations were globally serial though so any delay sleeps everything.

State machines, core.async and concurrent execution

Instead of weaving function invocations together we can model the problem as a set of independent state machines- each moving independently. 

Our transitions are pretty similar to the list we mentioned at the beginning: :downloadable -> :uploadable -> :completed. Each report (a combination of client and day) will progress from :downloadable to :completed

The local order of these operations is important (we can’t upload the report before we’ve downloaded it) but the global order isn’t important- it doesn’t matter whose report we process first. It's also important to note that our operations are idempotent- it also doesn't matter if we download/try to download the same report multiple times, likewise with the upload.

At each step our code will use the machine’s :state to determine which transition to apply. If we encounter an error whilst performing a transition we attach :error to the state with the exception, letting the machine retry the operation.

Our final code looks pretty close to the following:

  1. We create the states-ch channel to communicate each state of each machine (i.e. our unit of work).
  2. Processes are started to progress each of the state machines.
  3. Once a machine’s :state is :completed the final state is put on the completed channel (this helps us know when all work is finished).
  4. States are read from the states-ch channel and the appropriate operation performed. The result of each operation is the new state. We use thread to perform the operation and return a channel we can read the result from. 
  5. If an operation causes an exception to be raised it’s caught and we associate the exception value to the state map. After a small delay we put the state map back into the states channel for the operation to be attempted again.

Modeling the problem with state machines and implementing it with core.async gives a few nice properties:

  1. Operations are transparent. It’s easy to see what’s going on at any point in time.
  2. Failure is isolated and easily retryable: all values needed to perform an operation are held in the state maps so its really just a case of applying (step state) again.
  3. We use core.async’s timeout channel to defer the retry operation, letting us switch to a different op first.
  4. Overall throughput is increased. If we need to defer an operation we proceed with something else. Even on my 4-core laptop it results in ~6x greater throughput.

In short, we’re able to process many more reports concurrently than we were able to with our initial ‘dumb’ implementation and the code, I think, is vastly more readable than the nested error handling we used to have.

Syslogger: Forward syslog to Apache Kafka

Our team rewrote a small but key component within our data infrastructure earlier this year: a daemon to forward log data to Apache Kafka. Last week I made the repository public and thought it would be worth mentioning.

Our log data can be extremely valuable: helping us understand how users interact with our products and letting us measure the service we provide. Lots of services and daemons produce logs that we can usefully look at together to better understand the whole: nginx, varnish, our application services and more.

The problems with log files

Most of our applications and services would write their logs to files on disk. It’s convenient (to a point) when you can just tail a file to see what’s happening.

It’s ok when you’re administering a handful of machines with perhaps a few processes but it breaks when we start talking about the composition of systems. This is for a few reasons (nothing new of course but worth repeating):

  • Aggregating log files across your servers is important. No person/process is an island after all. By extension its necessary to replicate log files to a centralised place- you start having custom code to replicate files at particular times all over the place. In batches.
  • We can’t just continually write to a single unbounded file- we run the risk of consuming all available disk space and inadvertently affecting other processes running on the same machine.

Having said that, this is exactly what we did for a very long time (and still do in places). The primary issue we had was that we would lose data.

We were unable to track whether it was as a result of incorrectly handling the rotation event or that the volume of writes was sufficient for our tail process to gradually slowdown and drop the final segment of messages.

However, for all these reasons (being a poor citizen in the overall system and specific reliability problems) we decided to replace this section of our infrastructure.

Rsyslog and Syslogger

Rather than tailing files we’ll make sure we use syslog to write messages and rsyslog to forward those to files and aggregators. Since rsyslog communicates with a very simple TCP protocol we can write a daemon that will read a message send it directly to Kafka.

Rsyslog also has the advantage that it has a few features for more reliable message forwarding. For more detail please see “Reliable Forwarding of syslog Messages with Rsyslog”.

Implementing the system this way means that the bulk of the complexity we faced before can be borne by Rsyslog; our daemon just needs to read from TCP and send to Kafka.

There is another project that does exactly this but does so in a slightly different way: Syslog Collector. Centrally it chooses to queue messages in batches, we wanted to send them synchronously as TCP data are consumed. We tried to use this but couldn’t successfully consume messages and decided it would be relatively simple to re-implement and ensure we had exactly the behaviour we wanted.

Syslogger Design

Syslogger has a pretty simple set of principles behind it:

  1. Data are read and sent as part of the same process. Which is to say that a slow send into Kafka results in slow consumption from the listening socket. We lean heavily on Rsyslog.
  2. Initial Kafka broker details are extracted from ZooKeeper. Given consistent broker data is held there it makes sense to seed the connections from there; at uSwitch we have a production ZooKeeper quorum (on Amazon AWS) that uses Elastic IPs. Our broker IPs aren’t fixed, however.
  3. We try as much as possible to cleanly shut down the connection to ensure messages that have been delivered by Rsyslog are forwarded to Kafka. It’s impossible to guarantee this given TCP data are exchanged with both send and receive buffers, but we try to limit it as much as possible.

Deployment

We build binaries and packages that are deployed onto EC2. The syslogger process is managed by Upstart and monitored using metrics that are published to Riemann (for more on this take a look at my previous post on pushing metrics from Go to Riemann) so they can be reported alongside our other reporting dashboards.

We’ve been extremely happy with its behaviour and performance in production thus far- it’s been running for a few months without issue.

Monitoring Go programs with Riemann

uSwitch.com uses Riemann to monitor the operations of the various applications and services that compose our system. Riemann helps us aggregate systems and application metrics together and quickly assemble dashboards to understand how things are behaving now.

Most of these services and applications are written in Clojure, Java or Ruby, but recently we needed to monitor a service we implemented with Go.

Hopefully this is interesting for Go authors that haven’t come across Riemann or Clojure programmers who’ve not considered deploying Go before. I think Go is a very interesting option for building systems-type services.

Whence Go?

Recently at uSwitch the team I work on started replacing a small but core service from a combination of Java and Clojure programs to Go.

We’ve done this for probably 3 main reasons:

  1. Deploying a statically-linked binary with few other runtime dependencies (such as a JVM) makes deployment simpler and the process overhead smaller.
  2. Go’s systems roots makes it feel like your programming closer to the OS. Handling socket errors, process signals etc. They all feel better than writing through the Java (or other) abstractions.
  3. It also gives us the chance to experiment with something different in a small, contained way. This is the way I/we have been building systems for the last few years at uSwitch and for 7 or 8 years prior at TrafficBroker and Forward: we help systems emerge and evolve from smaller pieces. It provides a way to safely, and rapidly, learn about the best way to apply tools and languages in different situations through experimentation.

Monitoring systems

Riemann is a wonderful tool for monitoring the performance and operational behaviour of a system.

We’ve gone from using it to just aggregate health checks and alerting to running live in-production experiments to understand the best value EC2 hardware to run the system on. It’s proved both versatile and valuable.

For some of the services we’ve built Riemann is the primary way to see what the application is doing. We no longer build application-specific dashboards or admin interfaces. For example, our open-source systems Blueshift and Bifrost do this.

Getting data into Riemann

Riemann is really just an event stream processor: it receives incoming events and applies functions to produce statistics and alerts.

Although it’s possible for applications to write events directly- Riemann uses Protocol Buffers and TCP/UDP directly so its relatively easy to build clients. We’ve found it far easier, however, to use Metrics- a Java library that provides some slightly higher-level abstractions: Timers, Counters and more making it much cleaner and easier to integrate.

Although the original Metrics library was written for Java, an equivalent has been written in Go: go-metrics. We’ve contributed a Riemann reporter which is currently sitting inside a pull request, until then you can also use my fork with Riemann support.

Go Example reporting metrics to Riemann

Let’s consider an example to help understand how it can be helpful.

We’re building a service which will listen for TCP connections, perform some operation and then close the connection. One of the most obvious useful things we can monitor is the number of open socket connections we have. This might be useful for monitoring potential resource exhaustion, performance degradation or, just to see how many clients you have connected.

Our example service will: accept a connection, say hello, sleep for 5 seconds, close the connection. We’ll use a Counter metric that we’ll increment and decrement when clients open and close connections.

We create connCounter and register it in the metrics.DefaultRegistry before getting on with our work. As our program runs the registry stores the metric values. After registering our metric we start a goroutine that will periodically report all metric values to a Riemann instance. Note that our program imports my fork of go-metrics.

Our handleConnection function is responsible for servicing connected clients. It first increments the connCounter and then defers a decrement operation so we’ll decrement when our function returns.

This is a pretty trivial example, most of our services expose multiple different metrics recording things like counters for the number of open files, timers for the speed we can service requests (which will automatically calculate summary statistics), meters for whenever we experience an error etc.

Running the example

Although Riemann supports many different outputs we frequently use riemann-dash which lets you easily create (and save) custom dashboards with graphs, logs, gauges and more.

To help see what our example service does when its run I’ve recorded a small video that shows us running the service and a riemann-dash plot showing the number of open connections. After we’ve started the service we connect a couple of clients with telnet, the plot moves as connections are opened (and closed).

Update

Since I wrote and published this originally I've started to extract the code into a separate library. Please visit https://github.com/pingles/go-metrics-riemann for the latest code (and example). 

Introducing Bifrost: Archive Kafka data to Amazon S3

We're happy to announce the public release of a tool we've been using in production for a while now: Bifrost

We use Bifrost to incrementally archive all our Kafka data into Amazon S3; these transaction logs can then be ingested into our streaming data pipeline (we only need to use the archived files occasionally when we radically change our computation).

Rationale

There are a few other projects that scratch the same itch: notably Secor from Pinterest and Kafka's old hadoop-consumer. Although Secor doesn't rely on running Hadoop jobs, it still uses Hadoop's SequenceFile file format; sequence files allow compression and distributed splitting operations, as well as just letting you access the data in a record-oriented way. We'd been using code similar to Kafka's hadoop-consumer for a long time but it was running slowly and didn't do a great job of watching for new topics and partitions.

We wanted something that didn't introduce the cascade of Hadoop dependencies and would be able to run a little more hands-off.

Bifrost

Bifrost is the tool we wanted. It has a handful of configuration options that need to be set (e.g. S3 credentials, Kafka ZooKeeper consumer properties) and will continually monitor Kafka for new topics/partitions and create consumers to archive the data to S3. 

Here's an example configuration file:

Bifrost is written in Clojure and can be built using Leiningen. If you want to try it locally you can just `lein run`, or, for production you can build an uberjar and run:


Data is stored in "directories" in S3: s3://<bucket>/<kafka-consumer-group-id>/<topic>/partition=<partition-id>/0000000.baldr.gz (the filename is the starting offset for that file.

We use our Baldr file format: the first 8-bytes indicate the length of the record, then the following n-bytes represent the record itself, then another 8-byte record length etc. It provides almost all of what we need from SequenceFiles but without the Hadoop dependencies. We have a Clojure implementation but it should be trivial to write in any language. We also compress the whole file output stream with Gzip to speed up uploads and reduce the amount we store on S3.

Happy Kafka archiving!

Introducing Blueshift: Automated Amazon Redshift ingestion from Amazon S3

I’m very pleased to say I’ve just made public a repository for a tool we’ve built to make it easier to ingest data automatically into Amazon Redshift from Amazon S3: https://github.com/uswitch/blueshift.

Amazon Redshift is a wonderfully powerful product, if you’ve not tried it yet you should definitely take a look; I’ve written before about the value of the analytical flow it enables.

However, as nice as it is to consume data from, ingesting data is a little less fun:

  1. Forget about writing raw INSERT statements: we saw individual inserts take on the order of 5 or 6 seconds per record. Far too slow to support our usual stream let alone the flood given we reprocess the historical transaction log.
  2. Loading data from S3 is definitely the right thing to do. And, if you have a purely immutable append-only flow, this is trivial. However, if you need upsert behaviour you’ll have to write it yourself. Whilst not complicated, we have many different systems and teams pushing data into Redshift: each of these have a slightly different implementation of the same thing.
  3. We’ve seen lots of SQLException 1023 errors when we were reprocessing the historical transaction log across many different machines (our transaction log is itself already on S3 stored as lots of large Baldr files); with n machines in the cluster we’d end up with n transactions inserting into the same table.
  4. Redshift performs best when running loads operating over lots of files from S3: work is distributed to the cluster nodes and performed in parallel. Our original solution ended up with n transactions loading a smaller number of files.

Rationale

Blueshift makes life easier by taking away the client’s need to talk directly to Redshift. Instead, clients write data to S3 and Blueshift automatically manages the ingestion into Redshift.

Blueshift is a standalone service written in Clojure (a dialect of Lisp that targets the JVM) that is expected to be deployed on a server. It is configured to watch an S3 bucket; when it detects new data files and a corresponding Blueshift manifest it will perform an upsert transaction for all the files with the additional benefit of being a single import for a large number of files.

Using

You can build and run the application with Leiningen, a Clojure build tool:

The configuration file requires a minimal number of settings:

Most of it is relatively obvious but for the less obvious bits:

  • :key-pattern is a regex used to filter the directories watched within the S3 bucket; this makes it easier to have a single bucket with data from different environments.
  • :telemetry :reporters configures the Metrics reporters; a log reporter is included but we have an extra project (blueshift-riemann-metrics) for pushing data to Riemann.

Once the service is running you just need to write your delimited data files to the S3 bucket being watched and create the necessary Blueshift manifest. Your S3 layout might look something like this:

When Blueshift polls S3 it will pick up that 2 directories exist and create a watcher for each directory (directory-a/foo and directory-b in our example).

When the directory-a watcher runs it will notice there are 2 data files to be imported and a Blueshift manifest: manifest.edn: this is used to tell Blueshift where and how to import the data.

Of note in the example above:

  • :pk-columns is used to implement the merge upsert: rows in the target table (testing in the above example) that exist in our imported data are removed before the load: Redshift doesn’t enforce PK constraints so you have to delete the data first.
  • :options: can contain any of the options that Redshift’s COPY command supports.
  • :data-pattern helps Blueshift identify which files are suitable for being imported.

When the data has been imported successfully the data files are deleted from S3 leaving the Blueshift manifest ready for more data files.

Summary

We’re delighted with Amazon’s Redshift service and have released Blueshift to make it easier for people to optimally ingest data from their applications via S3 without talking to Redshift directly.

I’d love to hear from people if they find Blueshift useful and I’d be especially delighted for people to contribute (it’s currently less than 400 lines of Clojure).

Baldr: a record-oriented file format lib in Clojure

At uSwitch.com we’re in the process of migrating a lot of our data infrastructure to be much lighter-weight: pure Clojure and supporting libraries, rather than sitting atop Hadoop and other chunkier frameworks.

A lot of our activity stream data is currently archived in files on Amazon S3- specifically, Hadoop SequenceFiles; these are record-oriented files that contain key/value pairs suitable for MapReduce-style processing.

Working with SequenceFile formatted files requires a dependency on org.apache.hadoop/hadoop-core and a ton of transitive dependencies. Further, if you’re compressing the contents of the files (Hadoop SequenceFile’s support both record and block compression with Deflate, GZip and Snappy codecs) with GZip or Snappy compression you’ll need the hadoop-native lib which is a real effort/impossible to build on anything but Linux.

Being able to write arbitrary bytes to a file is really useful for serialization, but, we really need message/record boundaries when consuming those records back.

We were convinced that this file format must exist already but couldn’t find anything so we wrote a small library called Baldr for working with records of bytes.

We’re still convinced this kind of thing must already exist somewhere else or at least be called something in particular. But, in the meantime it solves the problem neatly (and with far fewer dependencies).

Significance Irrelevant in Online Experiments

Earlier this week I heard about Google Analytics’ new Content Experiments feature. The help also includes some interesting information about the engine used to run the experiments.

I did some further reading from the references and came across A Modern Bayesian Look at the Multi-armed Bandit by S. L. Scott.

The author of the paper makes a very interesting argument as to why multi-armed bandits suit online experiments better than classic null-hypothesis experiment methods: classic experiments control for the wrong type of error.

In a classical experiment we would randomise people into two groups, expose the two groups to different treatments, and finally collect data to measure the effect. We then use statistics to determine whether we have statistically significant evidence to reject the null hypothesis.

Scott argues that such experiments “are designed to be analyzed using methods that tightly control the type-I error rate under a null hypothesis of no effect”.

Type-I vs. Type-II Error

A Type-I error is the incorrect rejection of a true null hypothesis. That is, picking a treatment that isn’t materially better. In contrast, a Type-II error is “failing to reject a false null hypothesis”. That is, failing to switch to a better treatment.

Scott argues that in experiments with low switching costs, such as in online optimisation, type-II errors are more costly than type-I errors. In other words, it’s far worse for us to fail to try a better treatment than it is to incorrectly pick a treatment that isn’t materially better.

In short Scott states that, for online experiments, “the usual notion of statistical significance [is] largely irrelevant”.

Amazon Redshift + R: Analytics Flow

Ok, so it’s a slightly fanboy-ish title but I’m starting to really like the early experimentation we’ve been doing with Amazon’s Redshift service at uSwitch.

Our current data platform is a mix of Apache Kafka, Apache Hadoop/Hive and a set of heterogenous data sources mixed across the organisation (given we’re fans of letting the right store find it’s place).

The data we ingest is reasonably sizeable (gigabytes a day); certainly enough to trouble the physical machines uSwitch used to host with. However, for nearly the last 3 years we’ve been breaking uSwitch’s infrastructure and systems apart and it’s now much easier to consume whatever resources you need.

Building data systems on immutable principles also makes this kind of experimentation so much easier. For a couple of weeks we (Paul and I) have been re-working some of our data warehousing ETL to see what a Redshift analytics world looks like.

Of course it’s possible to just connect any JDBC SQL client to Redshift but we want to be able to do some more interactive analysis on the data we have. We want an Analytics REPL.

Redshift in R

I’m certainly still a novice when it comes to both statistical analyses and R but it’s something I’m enjoying- and I’m lucky to work with people who are great at both.

R already has a package for connecting to databases using JDBC but I built a small R package that includes both the Postgresql 8.4 JDBC driver and a few functions to make it nicer to interact with: Redshift.R. N.B. this was partly so I could learn about writing R packages, and partly about making it trivial for other R users in the company to get access to our experimental cluster.

The package is pretty easy to install- download the tarball, uncompress and run an R statement. The full instructions are available on the project’s homepage. Once you’ve installed it you’re done- no need to download anything else.

Flow

What I found really interesting, however, was how I found my workflow once data was accessible in Redshift and directly usable from inside my R environment; the 20 minute lead/cycle time for a Hive query was gone and I could work interactively.

I spent about half an hour working through the following example- it’s pretty noddy analytics but shows why I’m starting to get a little excited about Redshift: I can work mostly interactively without needing to break my work into pieces and switch around the whole time.

Disclosure

It would be remiss of me not to mention that R already has packages for connecting to Hadoop and Hive, and work to provide faster querying through tools like Cloudera’s Impala. My epiphany is probably also very old news to those already familiar with connecting to Vertica or Teradata warehouses with ODBC and R. 

The killer thing for me is that it cost us probably a few hundred dollars to create a cluster with production data in, kick the tyres, and realise there’s a much better analytics cycle for us out there. We're really excited to see where this goes.

Kafka for uSwitch's Event Pipeline

Kafka is a high-throughput, persistent, distributed messaging system that was originally developed at LinkedIn. It forms the backbone of uSwitch.com’s new data analytics pipeline and this post will cover a little about Kafka and how we’re using it.

Kafka is both performant and durable. To make it easier to achieve high throughput on a single node it also does away with lots of stuff message brokers ordinarily provide (making it a simpler distributed messaging system).

Messaging

Over the past 2 years we’ve migrated from a monolithic environment based around Microsoft .NET and SQL Server to a mix of databases, applications and services. These change over time: applications and servers will come and go.

This diversity is great for productivity but has made data analytics as a whole more difficult.

We use Kafka to make it easier for the assortment of micro-applications and services, that compose to form uSwitch.com, to exchange and publish data.

Messaging helps us decouple the parts of the infrastructure letting consumers and producers evolve and grow over time with less centralised coordination or control; I’ve referred to this as building a Data Ecosystem before.

Kafka lets us consume data in realtime (so we can build reactive tools and products) and provides a unified way of getting data into long-term storage (HDFS).

Consumers and producers

Kafka’s model is pretty general; messages are published onto topics by producers, stored on disk and made available to consumers. It’s important to note that messages are pulled by consumers to avoid needing any complex throttling in the event of slow consumption.

Kafka doesn’t dictate any serialisation it just expects a payload of byte[]. We’re using Protocol Buffers for most of our topics to make it easier to evolve schemas over time. Having a repository of definitions has also made it slightly easier for teams to see what events they can publish and what they can consume.

This is what it looks like in Clojure code using clj-kafka.

We use messages to record the products that are shown across our site, the searches that people perform, emails that are sent (and bounced), web requests and more. In total it’s probably a few million messages a day.

Metadata and State

Kafka uses Zookeeper for various bits of meta-information, including tracking which messages have already been retrieved by a consumer. To that end, it is the consumers responsibility to track consumption- not the broker. Kafka’s client library already contains a Zookeeper consumer that will track the message offsets that have been consumed.

As an side, the broker keeps no state about any of the consumers directly. This keeps it simple and means that there’s no need for complex structures kept in memory reducing the need for garbage collections.

When messages are received they are written to a log file (well, handed off to the OS to write) named after the topic; these are serial append files so individual writes don’t need to block or interfere with each other.

When reading messages consumers simply access the file and read data from it. It’s possible to perform parallel consumption through partitioned topics although this isn’t something we’ve needed yet.
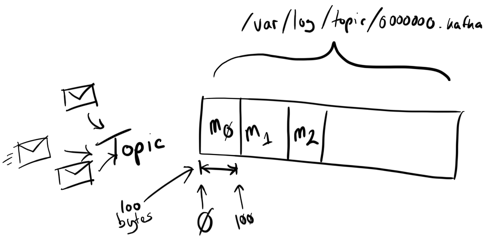
Topic and message storage

Messages are tracked by their offset- letting consumers access from a given point into the topic. A consumer can connect and ask for all messages that Kafka has stored currently, or from a specified offset. This relatively long retention (compared to other messaging systems) makes Kafka extremely useful to support both real-time and batch reads. Further, because it takes advantage of disk throughput it makes it a cost-effective system too.

The broker can be configured to keep messages up to a specified quantity or for a set period of time. Our broker is configured to keep messages for up to 20 days, after that and you’ll need to go elsehwere (most topics are stored on HDFS afterwards). This characteristic that has made it so useful for us- it makes getting data out of applications and servers and into other systems much easier, and more reliable, than periodically aggregating log files.

Performance

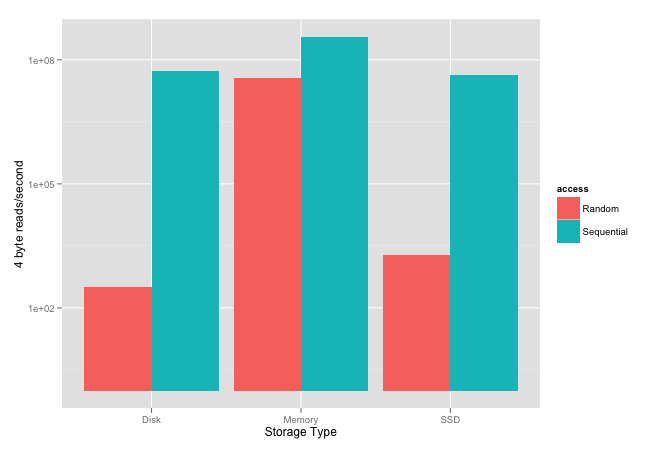
Kafka’s performance (and the design that achieves it) is derived from the observation that disk throughput has outpaced latency; it writes and reads sequentially and uses the operating system’s file system caches rather than trying to maintain its own- minimising the JVM working set, and again, avoiding garbage collections.

The plot below shows results published within an ACM article; their experiment was to measure how quickly they could read 4-byte values sequentially and randomly from different storage.
Performance

Please note the scale is logarithmic because the difference between random and sequential is so large for both SSD and spinning disks.

Interestingly, it shows that sequential disk access, spinning or SSD, is faster than random memory access. It also shows that, in their tests, sequential spinning disk performance was higher than SSD.

In short, using sequential reads lets Kafka get performance close to random memory access. And, by keeping very little in the way of metadata, the broker can be extremely lightweight.

If anyone is interested, the Kafka design document is very interesting and accessible.

Batch Load into HDFS

As I mentioned earlier, most topics are stored on HDFS so that we can maximise the amount of analysis we can perform over time.

We use a Hadoop job that is derived from the code included within the Kafka distribution.

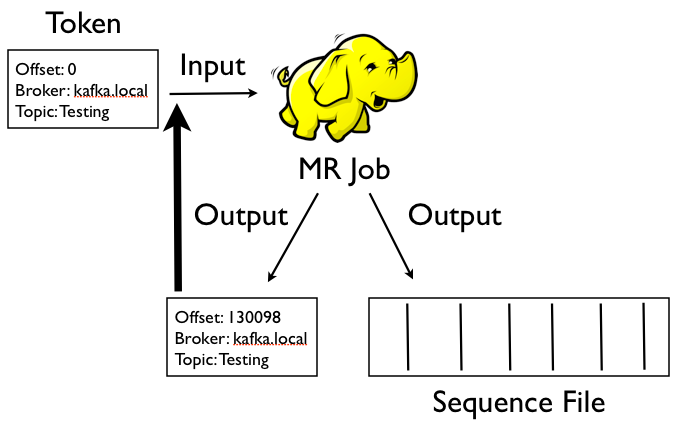
The process looks a little like this:
Hadoop Loading

Each topic has a directory on HDFS that contains 2 further subtrees: these contain offset token files and data files. The input to the Hadoop job is an offset token file which contains the details of the broker to consume from, the message offset to read from, and the name of the topic. Although it’s a SequenceFile the value bytes contain a string that looks like this:

broker.host.com topic-name  102991

The job uses a RecordReader that connects to the Kafka broker and passes the message payload directly through to the mapper. Most of the time the mapper will just write the whole message bytes directly out which is then written using Hadoop’s SequenceFileOutputFormat (so we can compress and split the data for higher-volume topics) and Hadoop’s MultipleOutputs so we can write out 2 files- the data file and a newly updated offset token file.

For example, if we run the job and consume from offset 102991 to offset 918280, this will be written to the offset token file:

broker.host.com topic-name  918280

Note that the contents of the file is exactly the same as before just with the offset updated. All the state necessary to perform incremental loads is managed by the offset token files.

This ensures that the next time the job runs we can incrementally load only the new messages. If we introduce a bug into the Hadoop load job we can just delete one or more of the token files to cause the job to load from further back in time.

Again, Kafka’s inherent persistence makes dealing with these kinds of HDFS loads much easier than dealing with polling for logs. Previously we’d used other databases to store metadata about the daily rotated logs we’d pulled but there was lots of additional computation in splitting apart files that would span days- incremental loads with Kafka are infinitely cleaner and efficient.

Kafka has helped us both simplify our data collection infrastructure, letting us evolve and grow it more flexibly, and provided the basis for building real-time systems. It’s extremely simple and very easy to setup and configure, I’d highly recommend it for anyone playing in a similar space.

Related Stuff

As I publish this LinkedIn have just announced the release of Camus: their Kafka to HDFS pipeline. The pipeline I’ve described above was inspired by the early Hadoop support within Kafka but has since evolved into something specific for use at uSwitch.

Twitter also just published about their use of Kafka and Storm to provide real-time search.

I can also recommend reading “The Unified Logging Infrastructure for Data Analytics at Twitter” paper that was published late last year.

Finally, this post was based on a brief presentation I gave internally in May last year: Kafka a Little Introduction

.