tag:oobaloo.co.uk,2013:/posts pingles 2024-04-01T08:31:31Z Paul Ingles tag:oobaloo.co.uk,2013:Post/1072367 2016-07-13T09:53:53Z 2024-04-01T08:12:42Z Google BigQuery: Copying data between projects and locations

I’ve worked on a tool called Big Replicate that we’ve open-sourced: it helps copy, and synchronise, data between different datasets in projects in Google BigQuery.

I’m a huge fan of Google’s BigQuery product: a large-scale, and affordable, hosted data-warehouse.

Data is stored in Tables, with sets of tables stored within a Dataset (all of which are part of a Google Cloud Project). Datasets can be stored in a number of different locations: the US, EU and Asia.

We use BigQuery most often with our Google Analytics data. Google provide a daily export of all hit data as part of their paid-for version of the product. But this data is automatically placed in a Dataset based in the US. If we want to connect it to our CRM data, for instance, that’s hosted within the EU then we need to copy data into the EU also.

We’ve written a tool that automatically synchronises data from one dataset into another. It works in such a way that it’s possible to copy data between both datasets within the same project, or datasets in entirely different projects. Further, datasets can be in different locations (allowing data to be copied from the US to the EU, for instance).

The code is available on GitHub: https://github.com/uswitch/big-replicate, with binaries also available.

For example, to synchronise any Google Analytics session tables:

The tool will find all tables that exist in the source dataset and not yet in the destination dataset, orders them lexicographically in reverse order by name (so table foo_20160712 is prioritised before foo_20160711). The top --number tables are copied. We use this to help migrate very large datasets over time, where we generally only need the more recent data immediately.

]]>
Paul Ingles
tag:oobaloo.co.uk,2013:Post/833029 2015-03-31T10:01:59Z 2024-04-01T08:14:17Z Multiplexing work reliably and efficiently with state machines and core.async

This all started with a tweet and brief exchange with a friend and ex-colleague:

This post describes some work we did recently that I’m pretty happy with: we model the execution of independent pieces of work as state machines which are executed concurrently by multiple core.async processes with state communicated over channels. 

Modeling with state machines helps flatten call chain complexity and makes retrying/recovering from error states trivial: we just try to apply the same transition to the same state again.

In short, we've improved both throughput and reliability.

Context

Specifically our problem was:

  1. Connect to a reporting API and download a report
  2. Transform the report, converting some values between units, currencies etc.
  3. Write the report out to S3 (ultimately to be ingested into our Redshift cluster)

It’s a pretty simple problem but when we’re downloading thousands of reports every day its likely that we’ll come across intermittent problems; mostly network errors connecting to the APIs or we’ll be rate throttled etc.

We started simple, making the most of the environment our system ran in.

Our original code was similar to this:

The reporting API lets us download aggregate information for a day and client.

Ensuring processes completed was the responsibility of a supervisor process. Although this was beautifully simple for the incremental work it was incredibly inefficient when running large imports:

  1. Our unit of work was all steps needed to download, process and upload a report. If any step failed we could only retry the whole.
  2. Even worse, if we were processing hundreds or thousands of reports together any failure would terminate and prevent all subsequent reports. We could unpick progress and change some command-line options to avoid doing too much again but it's painful.
  3. Handling errors was slow and painful. If our download request was rate limited we'd have to back-off; operations were globally serial though so any delay sleeps everything.

State machines, core.async and concurrent execution

Instead of weaving function invocations together we can model the problem as a set of independent state machines- each moving independently. 

Our transitions are pretty similar to the list we mentioned at the beginning: :downloadable -> :uploadable -> :completed. Each report (a combination of client and day) will progress from :downloadable to :completed

The local order of these operations is important (we can’t upload the report before we’ve downloaded it) but the global order isn’t important- it doesn’t matter whose report we process first. It's also important to note that our operations are idempotent- it also doesn't matter if we download/try to download the same report multiple times, likewise with the upload.

At each step our code will use the machine’s :state to determine which transition to apply. If we encounter an error whilst performing a transition we attach :error to the state with the exception, letting the machine retry the operation.

Our final code looks pretty close to the following:

  1. We create the states-ch channel to communicate each state of each machine (i.e. our unit of work).
  2. Processes are started to progress each of the state machines.
  3. Once a machine’s :state is :completed the final state is put on the completed channel (this helps us know when all work is finished).
  4. States are read from the states-ch channel and the appropriate operation performed. The result of each operation is the new state. We use thread to perform the operation and return a channel we can read the result from. 
  5. If an operation causes an exception to be raised it’s caught and we associate the exception value to the state map. After a small delay we put the state map back into the states channel for the operation to be attempted again.

Modeling the problem with state machines and implementing it with core.async gives a few nice properties:

  1. Operations are transparent. It’s easy to see what’s going on at any point in time.
  2. Failure is isolated and easily retryable: all values needed to perform an operation are held in the state maps so its really just a case of applying (step state) again.
  3. We use core.async’s timeout channel to defer the retry operation, letting us switch to a different op first.
  4. Overall throughput is increased. If we need to defer an operation we proceed with something else. Even on my 4-core laptop it results in ~6x greater throughput.

In short, we’re able to process many more reports concurrently than we were able to with our initial ‘dumb’ implementation and the code, I think, is vastly more readable than the nested error handling we used to have.

]]>
Paul Ingles
tag:oobaloo.co.uk,2013:Post/777075 2014-12-01T15:38:55Z 2014-12-03T22:58:16Z Syslogger: Forward syslog to Apache Kafka

Our team rewrote a small but key component within our data infrastructure earlier this year: a daemon to forward log data to Apache Kafka. Last week I made the repository public and thought it would be worth mentioning.

Our log data can be extremely valuable: helping us understand how users interact with our products and letting us measure the service we provide. Lots of services and daemons produce logs that we can usefully look at together to better understand the whole: nginx, varnish, our application services and more.

The problems with log files

Most of our applications and services would write their logs to files on disk. It’s convenient (to a point) when you can just tail a file to see what’s happening.

It’s ok when you’re administering a handful of machines with perhaps a few processes but it breaks when we start talking about the composition of systems. This is for a few reasons (nothing new of course but worth repeating):

  • Aggregating log files across your servers is important. No person/process is an island after all. By extension its necessary to replicate log files to a centralised place- you start having custom code to replicate files at particular times all over the place. In batches.
  • We can’t just continually write to a single unbounded file- we run the risk of consuming all available disk space and inadvertently affecting other processes running on the same machine.

Having said that, this is exactly what we did for a very long time (and still do in places). The primary issue we had was that we would lose data.

We were unable to track whether it was as a result of incorrectly handling the rotation event or that the volume of writes was sufficient for our tail process to gradually slowdown and drop the final segment of messages.

However, for all these reasons (being a poor citizen in the overall system and specific reliability problems) we decided to replace this section of our infrastructure.

Rsyslog and Syslogger

Rather than tailing files we’ll make sure we use syslog to write messages and rsyslog to forward those to files and aggregators. Since rsyslog communicates with a very simple TCP protocol we can write a daemon that will read a message send it directly to Kafka.

Rsyslog also has the advantage that it has a few features for more reliable message forwarding. For more detail please see “Reliable Forwarding of syslog Messages with Rsyslog”.

Implementing the system this way means that the bulk of the complexity we faced before can be borne by Rsyslog; our daemon just needs to read from TCP and send to Kafka.

There is another project that does exactly this but does so in a slightly different way: Syslog Collector. Centrally it chooses to queue messages in batches, we wanted to send them synchronously as TCP data are consumed. We tried to use this but couldn’t successfully consume messages and decided it would be relatively simple to re-implement and ensure we had exactly the behaviour we wanted.

Syslogger Design

Syslogger has a pretty simple set of principles behind it:

  1. Data are read and sent as part of the same process. Which is to say that a slow send into Kafka results in slow consumption from the listening socket. We lean heavily on Rsyslog.
  2. Initial Kafka broker details are extracted from ZooKeeper. Given consistent broker data is held there it makes sense to seed the connections from there; at uSwitch we have a production ZooKeeper quorum (on Amazon AWS) that uses Elastic IPs. Our broker IPs aren’t fixed, however.
  3. We try as much as possible to cleanly shut down the connection to ensure messages that have been delivered by Rsyslog are forwarded to Kafka. It’s impossible to guarantee this given TCP data are exchanged with both send and receive buffers, but we try to limit it as much as possible.

Deployment

We build binaries and packages that are deployed onto EC2. The syslogger process is managed by Upstart and monitored using metrics that are published to Riemann (for more on this take a look at my previous post on pushing metrics from Go to Riemann) so they can be reported alongside our other reporting dashboards.

We’ve been extremely happy with its behaviour and performance in production thus far- it’s been running for a few months without issue.

]]>
Paul Ingles
tag:oobaloo.co.uk,2013:Post/746479 2014-09-25T10:24:57Z 2024-04-01T08:14:08Z Monitoring Go programs with Riemann

uSwitch.com uses Riemann to monitor the operations of the various applications and services that compose our system. Riemann helps us aggregate systems and application metrics together and quickly assemble dashboards to understand how things are behaving now.

Most of these services and applications are written in Clojure, Java or Ruby, but recently we needed to monitor a service we implemented with Go.

Hopefully this is interesting for Go authors that haven’t come across Riemann or Clojure programmers who’ve not considered deploying Go before. I think Go is a very interesting option for building systems-type services.

Whence Go?

Recently at uSwitch the team I work on started replacing a small but core service from a combination of Java and Clojure programs to Go.

We’ve done this for probably 3 main reasons:

  1. Deploying a statically-linked binary with few other runtime dependencies (such as a JVM) makes deployment simpler and the process overhead smaller.
  2. Go’s systems roots makes it feel like your programming closer to the OS. Handling socket errors, process signals etc. They all feel better than writing through the Java (or other) abstractions.
  3. It also gives us the chance to experiment with something different in a small, contained way. This is the way I/we have been building systems for the last few years at uSwitch and for 7 or 8 years prior at TrafficBroker and Forward: we help systems emerge and evolve from smaller pieces. It provides a way to safely, and rapidly, learn about the best way to apply tools and languages in different situations through experimentation.

Monitoring systems

Riemann is a wonderful tool for monitoring the performance and operational behaviour of a system.

We’ve gone from using it to just aggregate health checks and alerting to running live in-production experiments to understand the best value EC2 hardware to run the system on. It’s proved both versatile and valuable.

For some of the services we’ve built Riemann is the primary way to see what the application is doing. We no longer build application-specific dashboards or admin interfaces. For example, our open-source systems Blueshift and Bifrost do this.

Getting data into Riemann

Riemann is really just an event stream processor: it receives incoming events and applies functions to produce statistics and alerts.

Although it’s possible for applications to write events directly- Riemann uses Protocol Buffers and TCP/UDP directly so its relatively easy to build clients. We’ve found it far easier, however, to use Metrics- a Java library that provides some slightly higher-level abstractions: Timers, Counters and more making it much cleaner and easier to integrate.

Although the original Metrics library was written for Java, an equivalent has been written in Go: go-metrics. We’ve contributed a Riemann reporter which is currently sitting inside a pull request, until then you can also use my fork with Riemann support.

Go Example reporting metrics to Riemann

Let’s consider an example to help understand how it can be helpful.

We’re building a service which will listen for TCP connections, perform some operation and then close the connection. One of the most obvious useful things we can monitor is the number of open socket connections we have. This might be useful for monitoring potential resource exhaustion, performance degradation or, just to see how many clients you have connected.

Our example service will: accept a connection, say hello, sleep for 5 seconds, close the connection. We’ll use a Counter metric that we’ll increment and decrement when clients open and close connections.

We create connCounter and register it in the metrics.DefaultRegistry before getting on with our work. As our program runs the registry stores the metric values. After registering our metric we start a goroutine that will periodically report all metric values to a Riemann instance. Note that our program imports my fork of go-metrics.

Our handleConnection function is responsible for servicing connected clients. It first increments the connCounter and then defers a decrement operation so we’ll decrement when our function returns.

This is a pretty trivial example, most of our services expose multiple different metrics recording things like counters for the number of open files, timers for the speed we can service requests (which will automatically calculate summary statistics), meters for whenever we experience an error etc.

Running the example

Although Riemann supports many different outputs we frequently use riemann-dash which lets you easily create (and save) custom dashboards with graphs, logs, gauges and more.

To help see what our example service does when its run I’ve recorded a small video that shows us running the service and a riemann-dash plot showing the number of open connections. After we’ve started the service we connect a couple of clients with telnet, the plot moves as connections are opened (and closed).

Update

Since I wrote and published this originally I've started to extract the code into a separate library. Please visit https://github.com/pingles/go-metrics-riemann for the latest code (and example). 

]]>
Paul Ingles
tag:oobaloo.co.uk,2013:Post/701060 2014-06-06T15:51:58Z 2024-04-01T07:48:42Z Introducing Bifrost: Archive Kafka data to Amazon S3

We're happy to announce the public release of a tool we've been using in production for a while now: Bifrost

We use Bifrost to incrementally archive all our Kafka data into Amazon S3; these transaction logs can then be ingested into our streaming data pipeline (we only need to use the archived files occasionally when we radically change our computation).

Rationale

There are a few other projects that scratch the same itch: notably Secor from Pinterest and Kafka's old hadoop-consumer. Although Secor doesn't rely on running Hadoop jobs, it still uses Hadoop's SequenceFile file format; sequence files allow compression and distributed splitting operations, as well as just letting you access the data in a record-oriented way. We'd been using code similar to Kafka's hadoop-consumer for a long time but it was running slowly and didn't do a great job of watching for new topics and partitions.

We wanted something that didn't introduce the cascade of Hadoop dependencies and would be able to run a little more hands-off.

Bifrost

Bifrost is the tool we wanted. It has a handful of configuration options that need to be set (e.g. S3 credentials, Kafka ZooKeeper consumer properties) and will continually monitor Kafka for new topics/partitions and create consumers to archive the data to S3. 

Here's an example configuration file:

Bifrost is written in Clojure and can be built using Leiningen. If you want to try it locally you can just `lein run`, or, for production you can build an uberjar and run:


Data is stored in "directories" in S3: s3://<bucket>/<kafka-consumer-group-id>/<topic>/partition=<partition-id>/0000000.baldr.gz (the filename is the starting offset for that file.

We use our Baldr file format: the first 8-bytes indicate the length of the record, then the following n-bytes represent the record itself, then another 8-byte record length etc. It provides almost all of what we need from SequenceFiles but without the Hadoop dependencies. We have a Clojure implementation but it should be trivial to write in any language. We also compress the whole file output stream with Gzip to speed up uploads and reduce the amount we store on S3.

Happy Kafka archiving!
]]>
Paul Ingles
tag:oobaloo.co.uk,2013:Post/697451 2014-05-29T11:05:21Z 2024-04-01T08:13:23Z Introducing Blueshift: Automated Amazon Redshift ingestion from Amazon S3

I’m very pleased to say I’ve just made public a repository for a tool we’ve built to make it easier to ingest data automatically into Amazon Redshift from Amazon S3: https://github.com/uswitch/blueshift.

Amazon Redshift is a wonderfully powerful product, if you’ve not tried it yet you should definitely take a look; I’ve written before about the value of the analytical flow it enables.

However, as nice as it is to consume data from, ingesting data is a little less fun:

  1. Forget about writing raw INSERT statements: we saw individual inserts take on the order of 5 or 6 seconds per record. Far too slow to support our usual stream let alone the flood given we reprocess the historical transaction log.
  2. Loading data from S3 is definitely the right thing to do. And, if you have a purely immutable append-only flow, this is trivial. However, if you need upsert behaviour you’ll have to write it yourself. Whilst not complicated, we have many different systems and teams pushing data into Redshift: each of these have a slightly different implementation of the same thing.
  3. We’ve seen lots of SQLException 1023 errors when we were reprocessing the historical transaction log across many different machines (our transaction log is itself already on S3 stored as lots of large Baldr files); with n machines in the cluster we’d end up with n transactions inserting into the same table.
  4. Redshift performs best when running loads operating over lots of files from S3: work is distributed to the cluster nodes and performed in parallel. Our original solution ended up with n transactions loading a smaller number of files.

Rationale

Blueshift makes life easier by taking away the client’s need to talk directly to Redshift. Instead, clients write data to S3 and Blueshift automatically manages the ingestion into Redshift.

Blueshift is a standalone service written in Clojure (a dialect of Lisp that targets the JVM) that is expected to be deployed on a server. It is configured to watch an S3 bucket; when it detects new data files and a corresponding Blueshift manifest it will perform an upsert transaction for all the files with the additional benefit of being a single import for a large number of files.

Using

You can build and run the application with Leiningen, a Clojure build tool:

The configuration file requires a minimal number of settings:

Most of it is relatively obvious but for the less obvious bits:

  • :key-pattern is a regex used to filter the directories watched within the S3 bucket; this makes it easier to have a single bucket with data from different environments.
  • :telemetry :reporters configures the Metrics reporters; a log reporter is included but we have an extra project (blueshift-riemann-metrics) for pushing data to Riemann.

Once the service is running you just need to write your delimited data files to the S3 bucket being watched and create the necessary Blueshift manifest. Your S3 layout might look something like this:

When Blueshift polls S3 it will pick up that 2 directories exist and create a watcher for each directory (directory-a/foo and directory-b in our example).

When the directory-a watcher runs it will notice there are 2 data files to be imported and a Blueshift manifest: manifest.edn: this is used to tell Blueshift where and how to import the data.

Of note in the example above:

  • :pk-columns is used to implement the merge upsert: rows in the target table (testing in the above example) that exist in our imported data are removed before the load: Redshift doesn’t enforce PK constraints so you have to delete the data first.
  • :options: can contain any of the options that Redshift’s COPY command supports.
  • :data-pattern helps Blueshift identify which files are suitable for being imported.

When the data has been imported successfully the data files are deleted from S3 leaving the Blueshift manifest ready for more data files.

Summary

We’re delighted with Amazon’s Redshift service and have released Blueshift to make it easier for people to optimally ingest data from their applications via S3 without talking to Redshift directly.

I’d love to hear from people if they find Blueshift useful and I’d be especially delighted for people to contribute (it’s currently less than 400 lines of Clojure).

]]>
Paul Ingles
tag:oobaloo.co.uk,2013:Post/689933 2014-05-12T14:07:52Z 2024-04-01T08:31:31Z Baldr: a record-oriented file format lib in Clojure

At uSwitch.com we’re in the process of migrating a lot of our data infrastructure to be much lighter-weight: pure Clojure and supporting libraries, rather than sitting atop Hadoop and other chunkier frameworks.

A lot of our activity stream data is currently archived in files on Amazon S3- specifically, Hadoop SequenceFiles; these are record-oriented files that contain key/value pairs suitable for MapReduce-style processing.

Working with SequenceFile formatted files requires a dependency on org.apache.hadoop/hadoop-core and a ton of transitive dependencies. Further, if you’re compressing the contents of the files (Hadoop SequenceFile’s support both record and block compression with Deflate, GZip and Snappy codecs) with GZip or Snappy compression you’ll need the hadoop-native lib which is a real effort/impossible to build on anything but Linux.

Being able to write arbitrary bytes to a file is really useful for serialization, but, we really need message/record boundaries when consuming those records back.

We were convinced that this file format must exist already but couldn’t find anything so we wrote a small library called Baldr for working with records of bytes.

We’re still convinced this kind of thing must already exist somewhere else or at least be called something in particular. But, in the meantime it solves the problem neatly (and with far fewer dependencies).

]]>
Paul Ingles
tag:oobaloo.co.uk,2013:Post/589617 2013-07-19T13:23:44Z 2024-04-01T08:02:03Z Significance Irrelevant in Online Experiments

Earlier this week I heard about Google Analytics’ new Content Experiments feature. The help also includes some interesting information about the engine used to run the experiments.

I did some further reading from the references and came across A Modern Bayesian Look at the Multi-armed Bandit by S. L. Scott.

The author of the paper makes a very interesting argument as to why multi-armed bandits suit online experiments better than classic null-hypothesis experiment methods: classic experiments control for the wrong type of error.

In a classical experiment we would randomise people into two groups, expose the two groups to different treatments, and finally collect data to measure the effect. We then use statistics to determine whether we have statistically significant evidence to reject the null hypothesis.

Scott argues that such experiments “are designed to be analyzed using methods that tightly control the type-I error rate under a null hypothesis of no effect”.

Type-I vs. Type-II Error

A Type-I error is the incorrect rejection of a true null hypothesis. That is, picking a treatment that isn’t materially better. In contrast, a Type-II error is “failing to reject a false null hypothesis”. That is, failing to switch to a better treatment.

Scott argues that in experiments with low switching costs, such as in online optimisation, type-II errors are more costly than type-I errors. In other words, it’s far worse for us to fail to try a better treatment than it is to incorrectly pick a treatment that isn’t materially better.

In short Scott states that, for online experiments, “the usual notion of statistical significance [is] largely irrelevant”.

]]>
Paul Ingles
tag:oobaloo.co.uk,2013:Post/579269 2013-05-30T18:46:00Z 2024-04-01T07:46:01Z Amazon Redshift + R: Analytics Flow

Ok, so it’s a slightly fanboy-ish title but I’m starting to really like the early experimentation we’ve been doing with Amazon’s Redshift service at uSwitch.

Our current data platform is a mix of Apache Kafka, Apache Hadoop/Hive and a set of heterogenous data sources mixed across the organisation (given we’re fans of letting the right store find it’s place).

The data we ingest is reasonably sizeable (gigabytes a day); certainly enough to trouble the physical machines uSwitch used to host with. However, for nearly the last 3 years we’ve been breaking uSwitch’s infrastructure and systems apart and it’s now much easier to consume whatever resources you need.

Building data systems on immutable principles also makes this kind of experimentation so much easier. For a couple of weeks we (Paul and I) have been re-working some of our data warehousing ETL to see what a Redshift analytics world looks like.

Of course it’s possible to just connect any JDBC SQL client to Redshift but we want to be able to do some more interactive analysis on the data we have. We want an Analytics REPL.

Redshift in R

I’m certainly still a novice when it comes to both statistical analyses and R but it’s something I’m enjoying- and I’m lucky to work with people who are great at both.

R already has a package for connecting to databases using JDBC but I built a small R package that includes both the Postgresql 8.4 JDBC driver and a few functions to make it nicer to interact with: Redshift.R. N.B. this was partly so I could learn about writing R packages, and partly about making it trivial for other R users in the company to get access to our experimental cluster.

The package is pretty easy to install- download the tarball, uncompress and run an R statement. The full instructions are available on the project’s homepage. Once you’ve installed it you’re done- no need to download anything else.

Flow

What I found really interesting, however, was how I found my workflow once data was accessible in Redshift and directly usable from inside my R environment; the 20 minute lead/cycle time for a Hive query was gone and I could work interactively.

I spent about half an hour working through the following example- it’s pretty noddy analytics but shows why I’m starting to get a little excited about Redshift: I can work mostly interactively without needing to break my work into pieces and switch around the whole time.

Disclosure

It would be remiss of me not to mention that R already has packages for connecting to Hadoop and Hive, and work to provide faster querying through tools like Cloudera’s Impala. My epiphany is probably also very old news to those already familiar with connecting to Vertica or Teradata warehouses with ODBC and R. 

The killer thing for me is that it cost us probably a few hundred dollars to create a cluster with production data in, kick the tyres, and realise there’s a much better analytics cycle for us out there. We're really excited to see where this goes.

]]>
Paul Ingles
tag:oobaloo.co.uk,2013:Post/85011 2013-01-09T09:43:00Z 2024-04-01T07:45:17Z Kafka for uSwitch's Event Pipeline

Kafka is a high-throughput, persistent, distributed messaging system that was originally developed at LinkedIn. It forms the backbone of uSwitch.com’s new data analytics pipeline and this post will cover a little about Kafka and how we’re using it.

Kafka is both performant and durable. To make it easier to achieve high throughput on a single node it also does away with lots of stuff message brokers ordinarily provide (making it a simpler distributed messaging system).

Messaging

Over the past 2 years we’ve migrated from a monolithic environment based around Microsoft .NET and SQL Server to a mix of databases, applications and services. These change over time: applications and servers will come and go.

This diversity is great for productivity but has made data analytics as a whole more difficult.

We use Kafka to make it easier for the assortment of micro-applications and services, that compose to form uSwitch.com, to exchange and publish data.

Messaging helps us decouple the parts of the infrastructure letting consumers and producers evolve and grow over time with less centralised coordination or control; I’ve referred to this as building a Data Ecosystem before.

Kafka lets us consume data in realtime (so we can build reactive tools and products) and provides a unified way of getting data into long-term storage (HDFS).

Consumers and producers

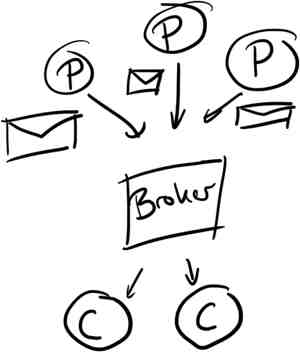
Kafka’s model is pretty general; messages are published onto topics by producers, stored on disk and made available to consumers. It’s important to note that messages are pulled by consumers to avoid needing any complex throttling in the event of slow consumption.

Kafka doesn’t dictate any serialisation it just expects a payload of byte[]. We’re using Protocol Buffers for most of our topics to make it easier to evolve schemas over time. Having a repository of definitions has also made it slightly easier for teams to see what events they can publish and what they can consume.

This is what it looks like in Clojure code using clj-kafka.

We use messages to record the products that are shown across our site, the searches that people perform, emails that are sent (and bounced), web requests and more. In total it’s probably a few million messages a day.

Metadata and State

Kafka uses Zookeeper for various bits of meta-information, including tracking which messages have already been retrieved by a consumer. To that end, it is the consumers responsibility to track consumption- not the broker. Kafka’s client library already contains a Zookeeper consumer that will track the message offsets that have been consumed.

As an side, the broker keeps no state about any of the consumers directly. This keeps it simple and means that there’s no need for complex structures kept in memory reducing the need for garbage collections.

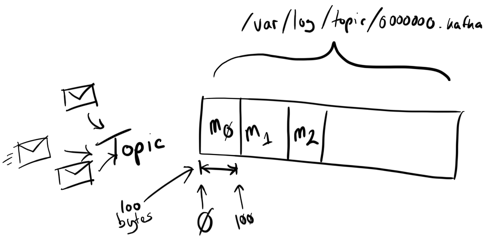
When messages are received they are written to a log file (well, handed off to the OS to write) named after the topic; these are serial append files so individual writes don’t need to block or interfere with each other.

When reading messages consumers simply access the file and read data from it. It’s possible to perform parallel consumption through partitioned topics although this isn’t something we’ve needed yet.

Topic and message storage

Messages are tracked by their offset- letting consumers access from a given point into the topic. A consumer can connect and ask for all messages that Kafka has stored currently, or from a specified offset. This relatively long retention (compared to other messaging systems) makes Kafka extremely useful to support both real-time and batch reads. Further, because it takes advantage of disk throughput it makes it a cost-effective system too.

The broker can be configured to keep messages up to a specified quantity or for a set period of time. Our broker is configured to keep messages for up to 20 days, after that and you’ll need to go elsehwere (most topics are stored on HDFS afterwards). This characteristic that has made it so useful for us- it makes getting data out of applications and servers and into other systems much easier, and more reliable, than periodically aggregating log files.

Performance

Kafka’s performance (and the design that achieves it) is derived from the observation that disk throughput has outpaced latency; it writes and reads sequentially and uses the operating system’s file system caches rather than trying to maintain its own- minimising the JVM working set, and again, avoiding garbage collections.

The plot below shows results published within an ACM article; their experiment was to measure how quickly they could read 4-byte values sequentially and randomly from different storage.

Performance

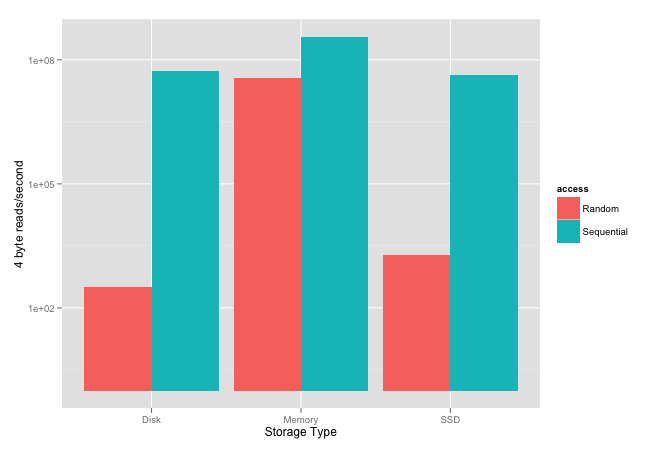
Please note the scale is logarithmic because the difference between random and sequential is so large for both SSD and spinning disks.

Interestingly, it shows that sequential disk access, spinning or SSD, is faster than random memory access. It also shows that, in their tests, sequential spinning disk performance was higher than SSD.

In short, using sequential reads lets Kafka get performance close to random memory access. And, by keeping very little in the way of metadata, the broker can be extremely lightweight.

If anyone is interested, the Kafka design document is very interesting and accessible.

Batch Load into HDFS

As I mentioned earlier, most topics are stored on HDFS so that we can maximise the amount of analysis we can perform over time.

We use a Hadoop job that is derived from the code included within the Kafka distribution.

The process looks a little like this:

Hadoop Loading

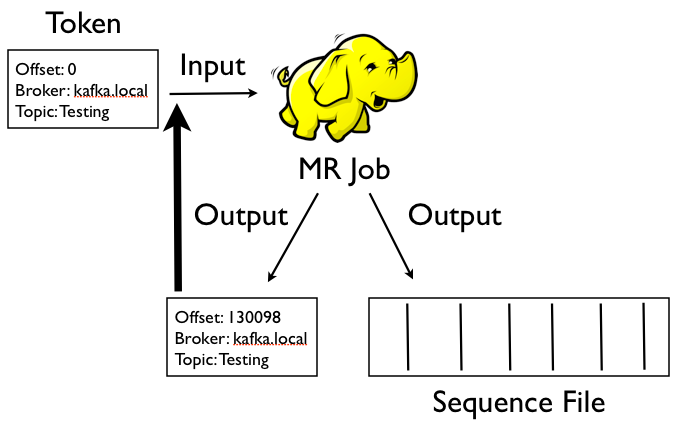
Each topic has a directory on HDFS that contains 2 further subtrees: these contain offset token files and data files. The input to the Hadoop job is an offset token file which contains the details of the broker to consume from, the message offset to read from, and the name of the topic. Although it’s a SequenceFile the value bytes contain a string that looks like this:

broker.host.com topic-name  102991

The job uses a RecordReader that connects to the Kafka broker and passes the message payload directly through to the mapper. Most of the time the mapper will just write the whole message bytes directly out which is then written using Hadoop’s SequenceFileOutputFormat (so we can compress and split the data for higher-volume topics) and Hadoop’s MultipleOutputs so we can write out 2 files- the data file and a newly updated offset token file.

For example, if we run the job and consume from offset 102991 to offset 918280, this will be written to the offset token file:

broker.host.com topic-name  918280

Note that the contents of the file is exactly the same as before just with the offset updated. All the state necessary to perform incremental loads is managed by the offset token files.

This ensures that the next time the job runs we can incrementally load only the new messages. If we introduce a bug into the Hadoop load job we can just delete one or more of the token files to cause the job to load from further back in time.

Again, Kafka’s inherent persistence makes dealing with these kinds of HDFS loads much easier than dealing with polling for logs. Previously we’d used other databases to store metadata about the daily rotated logs we’d pulled but there was lots of additional computation in splitting apart files that would span days- incremental loads with Kafka are infinitely cleaner and efficient.

Kafka has helped us both simplify our data collection infrastructure, letting us evolve and grow it more flexibly, and provided the basis for building real-time systems. It’s extremely simple and very easy to setup and configure, I’d highly recommend it for anyone playing in a similar space.

Related Stuff

As I publish this LinkedIn have just announced the release of Camus: their Kafka to HDFS pipeline. The pipeline I’ve described above was inspired by the early Hadoop support within Kafka but has since evolved into something specific for use at uSwitch.

Twitter also just published about their use of Kafka and Storm to provide real-time search.

I can also recommend reading “The Unified Logging Infrastructure for Data Analytics at Twitter” paper that was published late last year.

Finally, this post was based on a brief presentation I gave internally in May last year: Kafka a Little Introduction

.

]]>
Paul Ingles
tag:oobaloo.co.uk,2013:Post/85052 2012-12-19T15:35:00Z 2024-04-01T07:50:43Z Clojure - From Callbacks to Sequences

I was doing some work with a colleague earlier this week which involved connecting to an internal RabbitMQ broker and transforming some messages before forwarding them to our Kafka broker.

We’re using langohr to connect to RabbitMQ. Its consumer and queue documentation shows how to use the subscribe function to connect to a broker and print messages that arrive:

The example above is pretty close to what we started working with earlier today. It’s also quite similar to a lot of other code I’ve written in the past: connect to a broker or service and provide a block/function to be called when something interesting happens.

Sequences, not handlers

Although there’s nothing wrong with this I think there’s a nicer way: flip the responsibility so instead of the subscriber pushing to our handler function we consume it through Clojure’s sequence abstraction.

This is the approach I took when I wrote clj-kafka, a Clojure library to interact with LinkedIn’s Kafka (as an aside, Kafka is really cool- I’m planning a blog post on how we’ve been building a new data platform for uSwitch.com but it’s well worth checking out).

Here’s a little example of consuming messages through a sequence that’s taken from the clj-kafka README:

We create our consumer and access messages through a sequence abstraction by calling messages with the topic we wish to consume from.

The advantage of exposing the items through a sequence is that it becomes instantly composable with the many functions that already exist within Clojure: map, filter, remove etc.

In my experience, when writing consumption code that uses handler functions/callbacks I’ve ended up with code that looks like this:

It makes consuming data more complicated and pulls more complexity into the handler function than necessary.

Push to Pull

This is all made possible thanks to a lovely function written by Christophe Grande:

The function returns a vector containing 2 important parts: the sequence, and a function to put things into that sequence.

Returning to our original RabbitMQ example, we can change the subscriber code to use pipe to return the sequence that accesses the queue of messages:

We can then map, filter and more.

We pull responsibility out of the handler function and into the consumption of the sequence. This is really important, and it compliments something else which I’ve recently noticed myself doing more often.

In the handler function above I convert the function parameters to a map containing :payload, :ch and :msg-meta. In our actual application we’re only concerned with reading the message payload and converting it from a JSON string to a Clojure map.

Initially, we started writing something similar to this:

We have a function that exposes the messages through a sequence, but we pass a kind of transformation function as the last argument to subscriber-seq. This initially felt ok: subscriber-seq calls our handler and extracts the payload into our desired representation before putting it into the queue that backs the sequence.

But we’re pushing more responsibility into subscriber-seq than needs to be there.

We’re just extracting and transforming messages as they appear in the sequence so we can and should be building upon Clojure's existing functions: map and the like. The code below feels much better:

It feels better for a similar reason as moving the handler to a sequence- we’re making our function less complex and encouraging the composition through the many functions that already exist. Line 13 is a great example of this for me- map’ing a composite function to transform the incoming data rather than adding more work into subscriber-seq.

Pipe

I’ve probably used Christophe’s pipe function 3 or 4 times this year to take code that started with handler functions and evolved it to deal with sequences. I think it’s a really neat way of making callback-based APIs more elegant.

]]>
Paul Ingles
tag:oobaloo.co.uk,2013:Post/85058 2012-12-17T13:47:00Z 2024-04-01T08:13:48Z Multi-armed Bandit Optimisation in Clojure

The multi-armed (also often referred to as K-armed) bandit problem models the problem a gambler faces when attempting maximise the reward from playing multiple machines with varying rewards.

For example, let’s assume you are standing in front of 3 arms and that you don’t know the rate at which they will reward you. How do you set about the task of pulling the arms to maximise your cumulative reward?

It turns out there’s a fair bit of literature on this topic, and it’s also the subject of a recent O’Reilly book: “Bandit Algorithms for Website Optimization” by John Myles White (who also co-wrote the excellent Machine Learning for Hackers).

This article discusses my implementation of the algorithms which is available on GitHub and Clojars: https://github.com/pingles/clj-bandit.

Enter Clojure

I was happy to attend this year’s clojure-conj and started reading through the PDF whilst on the flight out. Over the next few evenings, afternoons and mornings (whenever I could squeeze in time) I spent some time hacking away at implementing the algorithms in Clojure. It was great fun and I pushed the results into a library: clj-bandit.

I was initially keen on implementing the same algorithms and being able to reproduce the results shown in the book. Since then I’ve spent a little time tweaking parts of the code to be a bit more functional/idiomatic. The bulk of this post covers this transition.

I started with a structure that looked like this:

From there I started layering on functions that select the arm with each algorithm’s select-arm implemented in its own namespace.

One of the simplest algorithms is Epsilon-Greedy: it applies a fixed probability when deciding whether to explore (try other arms) or exploit (pull the currently highest-rewarding arm).

The code, as implemented in clj-bandit, looks like this:

We generate a random number (between 0 and 1) and either pick the best performing or a random item from the arms.

In my initial implementation I kept algorithm functions together in a protocol, and used another protocol for storing/retrieving arm data. These were reified into an ‘algorithm’:

Applying select-arm to the current arm state would select the next arm to pull. Having pulled the arm, update-reward would let the ‘player’ track whether they were rewarded or not.

This worked, but it looked a little kludgey and made the corresponding monte-carlo simulation code equivalently disgusting.

I initially wanted to implement all the algorithms so I could reproduce the same results that were included in the book but the resulting code definitely didn’t feel right.

More Functional

After returning from the conference I started looking at the code and started moving a few functions around. I dropped the protocols and went back to the original datastructure to hold the algorithm’s current view of the world.

I decided to change my approach slightly and introduced a record to hold data about the arm.

The algorithms don’t need to know about the identity of any individual arm- they just need to pick one from the set. It tidied a lot of the code in the algorithms. For example, here’s the select-arm code from the UCB algorithm:

Functional Simulation

The cool part about the book and it’s accompanying code is that includes a simulation suitable for measuring the performance and behaviour of each of the algorithms.

This is important because the bandit algorithms have a complex feedback cycle: their behaviour is constantly changing in the light of data given to them during their lifetime.

For example, following from the code by John Myles White in his book, we can visualise the algorithm’s performance over time. One measure is accuracy (that is, how likely is the algorithm to pick the highest paying arm at a given iteration) and we can see the performance across algorithms over time, and according to their exploration/exploitation parameters, in the plot below:

The simulation works by using a series of simulated bandit arms. These will reward randomly according to a specified probability:

We can model the problem neatly by creating a function representing the arm, we can then pull the arm by applying the function.

As I mentioned earlier, when the code included protocols for algorithms and storage, the simulation code ended up being pretty messy. After I’d dropped those everything felt a little cleaner and more Clojure-y. This felt more apparent when it came to rewriting the simulation harness.

clj-bandit.simulate has all the code, but the key part was the introduction of 2 functions that performed the simulation:

simulation-seq creates a sequence through iterate’ing the simulate function. simulate is passed a map that contains the current state of the algorithm (the performance of the arms), it returns the updated state (based on the pull during that iteration) and tracks the cumulative reward. Given we’re most interested in the performance of the algorithm we can then just (map :result ...) across the sequence. Much nicer than nested doseq’s!

Further Work

At uSwitch we’re interested in experimenting with multi-armed bandit algorithms. We can use simulation to estimate performance using already observed data. But, we’d also need to do a little work to consume these algorithms into web applications.

There are existing Clojure libraries for embedding optimisations into your Ring application:

  1. Touchstone
  2. Bestcase

These both provide implementations of the algorithms and for storing their state in stores like Redis.

I chose to work through the book because I was interested in learning more about the algorithms but I also like the idea of keeping the algorithms and application concerns separate.

Because of that I’m keen to work on a separate library that makes consuming the algorithms from clj-bandit into a Ring application easier. I’m hoping that over the coming holiday season I’ll get a chance to spend a few more hours working on it.

]]>
Paul Ingles
tag:oobaloo.co.uk,2013:Post/85066 2012-11-22T13:51:00Z 2024-04-01T08:13:28Z Analysing and predicting performance of our Neo4j Cascading Connector with linear regression in R

As I mentioned in an earlier article, Paul and I have produced a library to help connect Cascading and Neo4j making it easy to sink data from Hadoop with Cascading flows into a Neo4j instance. Whilst we were waiting for our jobs to run we had a little fun with some regression analysis to optimise the performance. This post covers how we did it with R.

I’m posting because it wasn’t something I’d done before and it turned out to be pretty good fun. We played with it for a day and haven’t done much else with it since so I’m also publishing in case it’s useful for others.

We improved the write performance of our library by adding support for batching- collecting mutations into sets of transactions that are batched through Neo4j’s REST API. This improved performance (rather than using a request/response for every mutation) but also meant we needed to specify a chunk size; writing all mutations in a single transaction would be impossible.

There are 2 indepent variables that we could affect to tweak performance: the batch size and the number of simultaneous connections that are making those batch calls. N.B this assumes any other hidden factors remain constant.

For us, running this on a Hadoop cluster, these 2 variables determine the batch size in combination with the number of Hadoop’s reduce or map tasks concurrently executing.

We took some measurements during a few runs of the connector across our production data to help understand whether we were making the library faster. We then produced a regression model from the data and use the optimize function to help identify the sweet spot for our job’s performance.

We had 7 runs on our production Hadoop cluster. We let the reduce tasks (where the Neo4j write operations were occurring) run across genuine data for 5 minutes and measured how many nodes were successfully added to our Neo4j server. Although the cluster was under capacity (so the time wouldn’t include any idling/waiting) our Neo4j server instance runs on some internal virtualised infrastructure and so could have exhibited variance beyond our changes.

The results for our 7 observerations are in the table below:

Test No. Number of Reducers Batch Size Nodes per minute
1 1 10 5304.4
2 4 10 13218.8
3 4 20 13265.636
4 8 5 11289.2
5 8 10 17682.2
6 16 10 20984.2
7 8 20 20201.6

Regression in R

A regression lets us attempt to predict the value of a continuous variable based upon the value of one or more other independent variables. It also lets us quantify the strength of the relationship between the dependent variable and independent variables.

Given our experiment, we could determine whether batch size and the number of reducers (the independent variables) affected the number of Neo4j nodes we could create per minute (the dependent variable). If there was, we would use values for those 2 variables to predict performance.

The first stage is to load the experiment data into R and get it into a data frame. Once we’ve loaded it we can use R’s lm function to fit a linear model and look at our data.

In the above, the formula parameter to lm lets us describe that nodes.per.minute is our dependent variable (our outcome), and reducers and batch.size are our independent variables (our predictors).

Much like other analysis in R, the first thing we can look at is a summary of this model, which produces the following:

lm(formula = nodes.per.minute ~ reducers + batch.size, data = results)

Residuals:
    1     2     3     4     5     6     7 
-2330  2591 -1756 -1135  3062 -1621  1188 

Coefficients:
            Estimate Std. Error t value Pr(>|t|)  
(Intercept)   2242.8     3296.7   0.680   0.5336  
reducers       998.1      235.6   4.236   0.0133 *
batch.size     439.3      199.3   2.204   0.0922 .
---
Signif. codes:  0 ‘***’ 0.001 ‘**’ 0.01 ‘*’ 0.05 ‘.’ 0.1 ‘ ’ 1 

Residual standard error: 2735 on 4 degrees of freedom
Multiple R-squared: 0.8362, Adjusted R-squared: 0.7543 
F-statistic: 10.21 on 2 and 4 DF,  p-value: 0.02683

The summary data tells us that the model supports the data relatively well. Our R-squared is 0.075 and both batch size and reducer size are considered significant.

But, what if we tweak our model? We suspect that the shape of the performance through increasing reducers and batch size is unlikely to exhibit linear growth. We can change the formula of our model and see whether we can improve the accuracy of our model:

And let’s the the results of calling summary(model):

Call:
lm(formula = nodes.per.minute ~ reducers + I(reducers^2) + batch.size + 
    I(batch.size^2), data = results)

Residuals:
         1          2          3          4          5          6          7 
-2.433e+02  9.318e+02 -3.995e+02  9.663e-13 -7.417e+02  5.323e+01  3.995e+02 

Coefficients:
                 Estimate Std. Error t value Pr(>|t|)  
(Intercept)     -15672.16    3821.48  -4.101   0.0546 .
reducers          2755.10     337.07   8.174   0.0146 *
I(reducers^2)     -101.74      18.95  -5.370   0.0330 *
batch.size        2716.07     540.07   5.029   0.0373 *
I(batch.size^2)    -85.94      19.91  -4.316   0.0497 *
---
Signif. codes:  0 ‘***’ 0.001 ‘**’ 0.01 ‘*’ 0.05 ‘.’ 0.1 ‘ ’ 1 

Residual standard error: 948.6 on 2 degrees of freedom
Multiple R-squared: 0.9901, Adjusted R-squared: 0.9704 
F-statistic: 50.25 on 4 and 2 DF,  p-value: 0.01961

Our R-squared is now 0.9704- our second model fits the data better than our first model.

Optimization

Given the above, we’d like to understand the values for batch size and number of reducers that will give us the highest throughput.

R has an optimize function that, given a range of values for a function parameter, returns the optimal argument for the return value.

We can create a function that calls predict.lm with our model to predict values. We can then use the optimize function to find our optimal solution:

We use a set batch size of 20 and optimize to discover that the optimal number of reducers is 13 with a throughput of 22,924 nodes/minute. The second command optimizes for batch size with a fixed number of reducers. Again, it suggests a batch size of 15 for an overall throughput of 24,409 nodes/minute.

This supports what we observed earlier with the summary data: number of reducers is more significant than batch size for predicting throughput.

I’m extremely new to most of R (and statistics too if I’m honest- the last year is the most I’ve done since university) so if anyone could tell me if there’s a way to perform an optimization for both variables that would be awesome.

Please note this post was more about our experimentation and the process- I suspect our data might be prone to systematic error and problems because we only have a few observations. I’d love to run more experiments and get more measurements but we moved on to a new problem :)

]]>
Paul Ingles
tag:oobaloo.co.uk,2013:Post/85075 2012-11-22T10:53:00Z 2024-04-01T07:58:13Z Sinking Data to Neo4j from Hadoop with Cascading

Recently, I worked with a colleague (Paul Lam, aka @Quantisan on building a connector library to let Cascading interoperate with Neo4j: cascading.neo4j. Paul had been experimenting with Neo4j and Cypher to explore our data through graphs and we wanted an easy way to flow our existing data on Hadoop into Neo4j.

The data processing pipeline we’ve been growing at uSwitch.com is built around Cascalog, Hive, Hadoop and Kafka.

Once the data has been aggregated and stored a lot of our ETL is performed upon Cascalog and, by extension, Cascading. Querying/analysis is a mix of Cascalog and Hive. This layer is built upon our long-term data storage system: Hadoop; this, all combined, lets us store high-resolution data immutably at a much lower cost than uSwitch’s previous platform.

Cascading is:

application framework for Java developers to quickly and easily develop robust Data Analytics and Data Management applications on Apache Hadoop

Cascading provides a model on top of Hadoop’s very file-oriented, raw MapReduce API. It models the world around flows of data (Tuples), between Taps and according to Schemes.

For example, in Hadoop you might configure a job that reads data from a SequenceFile at a given location on HDFS. Cascading separates the 2 into slightly different concerns- the Tap would represent file storage on HDFS, the Scheme would be configured to read data according to the SequenceFile format.

Cascading provides a lot of classes to make it easier to build flows that join and aggregate data without you needing to write lots of boiler-plate MapReduce code.

Here’s an example of writing a Cascading flow (taken from the README of our cascading.neo4j library). It reads data from a delimited file (representing the Neo4j Nodes we want to create), and flows every record to our Neo4j Tap.

Although we use Cascading, really the majority of that is through Cascalog- a Clojure library that provides a datalog like language for analysing our data.

We wrote a small test flow we could use whilst testing our connector, a similar Cascalog example for the Cascading code above looks like this:

Our library, cascading.neo4j (hosted on Conjars.org) provides a Tap and Scheme suitable for sinking (writing data) to a Neo4j server using their REST connector. We extend and implement Cascading classes and interfaces making it easy to then integrate into our Cascalog processing.

cascading.neo4j allows you to create nodes, set properties on those node, add nodes to an exact match index, and create relationships (again with properties) between those nodes.

I should point out that cascading.neo4j may not be suitable for all batch processing purposes: most significantly, its pretty slow. Our production Neo4j server (on our internal virtualised infrastructure) lets us sink around 20,000 nodes per minute through the REST api. This is certainly a lot slower than Neo4j’s Batch Insert API and may make it unusable in some situations.

However, if the connector is fast enough for you it means you can sink data directly to Neo4j from your existing Cascading flows.

Performance

Whilst tweaking and tuning the connector we ran through Neo4j’s Linux Performance Guide (a great piece of technical documentation) that helped us boost performance a fair bit.

We also noticed the REST library allows for transactions to hold batch operations- to include multiple mutations in the same roundtrip. Our Neo4j RecordWriter will chunk batches- rather than writing all records in one go, you can specify the size.

We ran some tests and, on our infrastructure, using batch sizes of around 15 and 13 reducers (that is 13 ‘connections’ to our Neo4j REST api) yield the best performance of around 20,000 nodes per minute. We collected some numbers and Paul suggested we could have some fun putting those through a regression which will be the subject of my next post :)

Next steps

It’s currently still evolving a little and there’s a bit of duplicate code between the Hadoop and Local sections of the code. The biggest restrictions are it currently only supports sinking (writing) data and it’s speed may make it unsuitable for flowing very large graphs.

Hopefully this will be useful for some people and Paul and I would love pull requests for our little project.

]]>
Paul Ingles
tag:oobaloo.co.uk,2013:Post/85081 2012-08-18T13:44:00Z 2024-04-01T08:12:14Z Compressing CloudFront Assets and dfl8.co

Amazon’s web services have made rebuilding uSwitch.com so much easier. We’re gradually moving more and more static assets to CloudFront (although most visitors are in the UK responses have much lower latencies than direct from S3 or even our own nginx servers). CloudFront doesn't support serving gzip'ed content direct from S3 out of the box.

Because of this, up until last week we were serving uncompressed assets, at least anything that wasn’t already compressed (such as images). Last week we put together a simple static assets nginx server to help compress things.

Whilst doing the work for uSwitch.com I realised it would be trivial to write an application that would let any CloudFront user compress to any S3 bucket by using an equivalent URL structure. So I knocked up a quick node.js app that’s hosted on Heroku for all to use: dfl8.co.

dfl8.co

S3 assets can be referenced through a pretty simple URL structure. By creating an app that behaves in the same way, and proxies (whilst compressing) the response, it would be easy to create a compressible S3 for everyone.

For example, the URL http://pingles-example.s3.amazonaws.com/sample.css references the S3 bucket pingles-example and the object we want to retrieve is identified by the name /sample.css.

The same resource can be accessed through http://pingles-example.dfl8.co/sample.css and will be gzip compressed. CloudFront now lets you specify custom origins so for the above you’d add http://pingles-example.dfl8.co to setup a CloudFront distribution for the pingles-example S3 bucket.

At the moment it will only proxy public resources. Response latency also seems quite high at the moment but given the aim is to get content into the highly-cached and optimised CloudFront I’m not too fussed by it.

]]>
Paul Ingles
tag:oobaloo.co.uk,2013:Post/85088 2012-07-15T21:06:00Z 2024-04-01T07:27:57Z Evaluating classifier results with R part 2

In a previous article I showed how to visualise the results of a classifier using ggplot2 in R. In the same article I mentioned that Alex, a colleague at Forward, had suggested looking further at R’s caret package that would produce more detailed statistics about the overall performance of the classifer and within individual classes.

Confusion Matrix

Using ggplot2 we can produce a plot like the one below: a visual representation of a confusion matrix. It gives us a nice overview but doesn’t reveal much about the specific performance characteristics of our classifier.

To produce our measures, we run our classifier across a set of test data and capture both the actual class and the predicted class. Our results are stored in a CSV file and will look a little like this:

actual, predicted
A, B
B, B,
C, C
B, A

Analysing with Caret

With our results data as above we can run the following to produce a confusion matrix with caret:

results.matrix now contains a confusionMatrix full of information. Let’s take a look at some of what it shows. The first table shows the contents of our matrix:

Reference
Prediction              A     B     C     D
A                     211   3     1     0
B                     9     26756 6     17
C                     1     12    1166  1
D                     0     18    3     1318

Each column holds the reference (or actual) data and within each row is the prediction. The diagonal represents instances where our observation correctly predicted the class of the item.

The next section contains summary statistics for the results:

Overall Statistics

                     Accuracy : 0.9107          
                       95% CI : (0.9083, 0.9131)
          No Information Rate : 0.5306          
          P-Value [Acc > NIR] : < 2.2e-16

Overall accuracy is calculated at just over 90% with a p-value of 2 x 10^-16, or 0.00000000000000022. Our classifier seems to be doing a pretty reasonable job of classifying items.

Our classifier is being tested by putting items into 1 of 13 categories- caret also produces a final section of statistics for the performance of each class.

Class: A        Class: B  ...   Class: J
Sensitivity             0.761733        0.9478          0.456693
Specificity             0.998961        0.9748          0.999962
Pos Pred Value          0.793233        0.9770          0.966667 
Neg Pred Value          0.998753        0.9429          0.998702
Prevalence              0.005206        0.5306          0.002387
Detection Rate          0.003966        0.5029          0.001090
Detection Prevalence    0.005000        0.5147          0.001128

The above shows some really interesting data.

Sensitivity and specificity respectively help us measure the performance of the classifier in correctly predicting the actual class of an item and not predicting the class of an item that is of a different class; it measures true positive and true negative performance.

From the above data we can see that our classifier correctly identified class B 94.78% of the time. That is, when we should have predicted class B we did. Further, when we shouldn’t have predicted class B we didn’t for 97.48% of examples. We can contrast this to class J: our specificity (true negative) is over 99% but our sensitivity (true positive) is around 45%; we do a poor job of positively identifying items of this class.

Caret has also calculated a prevalence measure- that is, of all observations, how many were of items that actually belonged to the specified class; it calculates the prevalence of a class within a population.

Using the previously defined sensitivity and specificity, and prevalance measures caret can calculate Positive predictive value and Negative predictive value. These are important as they reflect the probability that a true positive/true negative is correct given knowledge about the prevalence of classes within the population. Class J has a positive predictive value of over 96%: despite our classifier only being able to positively identify objects 45% of the time there’s a 96% chance that, when it does, such a classification is correct.

The caret documentation has some references to relevant papers discussing the measures it calculates.

]]>
Paul Ingles
tag:oobaloo.co.uk,2013:Post/85092 2012-07-14T15:13:00Z 2024-04-01T08:13:48Z Visualising classifier results with R and ggplot2

Earlier in the year, myself and some colleagues started working on building better data processing tools for uSwitch.com. Part of the theory/reflection of this is captured in a presentation I was privileged to give at EuroClojure (titled Users as Data).

In the last few days, our data team (Thibaut, Paul and I) have been playing around with some of the data we collect and using it to build some classifiers. Precision and Recall provide quantitative measures but reading through Machine Learning for Hackers showed some nice ways to visualise results.

Binary Classifier

Our first classifier attempted to classify data into 2 groups. Using R and ggplot2 I produced a plot (similar to the one presented in the Machine Learning for Hackers book) to show the results of the classifier.

Our results were captured in a CSV file and looked a little like this:

A,0.25,0.15
A,0.2,0.19
B,0.19,0.25

Each line contains the item's actual class, the predicted probability for membership of class A, and the predicted probability for membership of class B. Using ggplot2 we produce the following:

binary classification plot

Items have been classified into 2 groups- A and B. The axis show the log probability (we’re using Naive Bayes to classify items) that the item belongs to the specified class. We use colour to identify the actual class for items and draw a line to represent the decision boundary (i.e. which of the 2 classes did our model predict).

This lets us nicely see the relationship between predicted and actual classes.

We can see there’s a bit of an overlap down the decision boundary line and we’re able to do a better job for classifying items in category B than A.

The R code to produce the plot above is as follows. Note that because we had many millions of observations I randomly sampled to make it possible to compute on my laptop :)

More Classes!

But what if we want to see compare the results when we’re classifying items into more than 1 group?

After chatting to Alex Farquhar (another data guy at Forward) he suggested plotting a confusion matrix.

Below shows the plot we produced that compares the actual and predicted classes for 14 items.

The y-axis shows the predicted class for all items, and the x-axis shows the actual class. The tiles are coloured according to the frequency of the intersection of the two classes thus the diagonal represents where we predict the actual class. The colour represents the relative frequency of that observation in our data; given some classes occur more frequently we normalize the values before plotting.

Any row of tiles (save for the diagonal) represents instances where we falsely identified items as belonging to the specified class. In the rendered plot we can see that items in Class G were often identified for items belonging to all other classes.

Our input data looked a little like this:

1,0,0
0,3,0
1,0,2

It’s a direct encoding of our matrix- each column represents data for classes A to N, and each row represents data for classes A to N. The diagonal holds data for A,A, B,B, etc.

The R code to plot the confusion matrix is as follows:

Alex also suggested using the caret package which includes a function to build the confusion matrix from observations directly and also provides some useful summary statistics. I’m going to hack on our classifier’s Clojure code a little more and will be sure to post again with the findings!

]]>
Paul Ingles
tag:oobaloo.co.uk,2013:Post/85095 2012-01-20T10:08:00Z 2024-04-01T08:13:53Z Protocol Buffers with Clojure and Leiningen

This week I’ve been prototyping some data processing tools that will work across the platforms we use (Ruby, Clojure, .NET). Having not tried Protocol Buffers before I thought I’d spike it out and see how it might fit.

Protocol Buffers

The Google page obviously has a lot more detail but for anyone who’s not seen them: you define your messages in an intermediate language before compiling into your target language.

There’s a Ruby library that makes it trivially easy to generate Ruby code so you can create messages as follows:

Clojure and Leiningen

The next step was to see how these messages would interact with Clojure and Java. Fortunately, there’s already a few options and I tried out clojure-protobuf which conveniently includes a Leiningen task for running both the Protocol Buffer compiler protoc and javac.

I added the dependency to my project.clj:

[protobuf "0.6.0-beta2"]

At the time, the protobuf library expected your .proto files to be placed in a ./proto directory under your project root. I forked to add a :proto-path so that I could pull in the files from a git submodule.

Assuming you have a proto file or two in your proto source directory, you should be able to invoke the compiler by running

$ lein protobuf compile
Compiling person.proto to /Users/paul/Work/forward/data-spike/protosrc
Compiling 1 source files to /Users/paul/Work/forward/data-spike/classes

You should now see some Java .class files in your ./classes directory.

Using clojure-protobuf to load an object from a byte array looks as follows:

Uberjar Time

I ran into a little trouble when I came to build the command-line tool and deploy it. When building with lein uberjar it seemed that the ./classes directory was being cleaned causing the protobuf compiled Java classes to be unavailable to the application (causing the rest of the application to fail to build- I was using tools.cli with a main fn which meant using :gen-class).

I always turn to Leiningen’s sample project.clj and saw :clean-non-project-classes. The comment mentioned it was set to false by default so that wasn’t it.

It turns out that Leiningen’s uberjar task checks a different option when determining whether to clean the project before executing: :disable-implicit-clean. I added :disable-implicit-clean true to our project.clj and all was good:

$ lein protobuf compile, uberjar

I wasn’t a registered user of the Leiningen mailing list (and am waiting for my question to be moderated) but it feels like uberjar should honour :clean-non-project-class too. I’d love to submit a patch to earn myself a sticker :)

]]>
Paul Ingles
tag:oobaloo.co.uk,2013:Post/85100 2012-01-12T13:21:00Z 2013-10-08T15:39:42Z Social Enterprise Development

When I read the transcript of Linus Torvald’s talk on Git at Google I was working at an investment bank in London and it was about 4 years ago. It was just as I’d started using GitHub for hosting my own side-projects and for doing some open-source work. Fast forward to today and I’ve just read an article about the fast rise of GitHub as the software repository of choice for open-source development and an interesting space for Enterprise hosting.

All the banks I worked in were extremely centrally controlled: you’d use approved libraries and tools only. However, the way that the different teams interacted seemed very close to the open-source model espoused by Linux. I think there’s a very strong benefit such centralised organisations could gain through adopting a slightly more bazaar approach.

Teams and Structure

It was probably the second or third bank I’d worked in and I was struck by the way that teams at the bank were structured (as compared to the other types of organisations I’d worked at). One set of developers would maintain the front-end of the trading system, another would work on the back-office services that would process the trades, and another would provide the quantitative libraries used for pricing them.

The work each team did was quite different, requiring different types of skill and with varying levels of change etc.

The quantitative libraries would need to be updated as the bank started changing the way it modeled the trades they performed and would frequently receive performance improvements. The trading application would receive the occasional UI tweak or new feature to allow traders to enter new kinds of trade, or provide quicker ways for them to do it.

The front-end application team would frequently need to incorporate quantitative library changes as they released new versions (at least once a week). This would require the team to run tests to ensure that the newly integrated pricing library would behave properly: producing identical trades that priced the same.

Often changes within the pricing library would break the application through throwing errors or producing trades with corrupted numbers. The front-end team would then have to step through the pricing integration code to figure out where it went wrong.

Of course, the pricing libraries were kept close to the core; trying to figure out why something had changed would require the front-end teams to reverse-engineer a little about the quantitative library. The quant team would often be too busy to help much with identifying the cause of the problems. And, after all, the problems were just as likely to be caused by an error in the integration code.

Social Models

What struck me at the time was how close the social behaviour of the teams was to open-source development and how distributed source-control (like Git) and social software (like GitHub) would be a relatively natural extension.

Going to the project/product/technical lead would almost certainly result in your request being queued into a long backlog. Instead, you would speak directly to another developer you were friendly with and they’d help point you in the right direction or confirm there was a problem.

Most front-end developers were capable of stepping through the pricing code and identifying what was causing their problem. They may not be the best people to be maintaining pricing code on a day-to-day basis, but they can certainly diagnose and fix most problems they’d uncover.

But, because the quant team were locked away, making changes would be reliant on entering into the backlog, or relying on a somewhat rogue (but friendly) quant.

Distributed Enterprise

The models of distributed source control and open-source application development seem natural enterprise fits: teams focus on their libraries with the development co-ordinated through their regular teams in largely the same way it is currently.

The difference is that code repositories could be more easily shared between teams. Nobody outside the quant team pushes to the central repository directly. Instead, they fork the pricing library to do their debugging and analysis, hopefully find the problem, create a branch to fix the issue and submit a pull request. They speak to their go-to person on the team and talk things through. They either pull directly in, or can use it as a starting point for integrating changes.

I remember talking this through with one of the front-end application developers at the time. It seemed like an obvious (albeit bold) thing to try.

]]>
Paul Ingles
tag:oobaloo.co.uk,2013:Post/85109 2011-09-12T17:23:00Z 2024-04-01T07:37:59Z Introducing node-hdfs: node.js client for Hadoop HDFS

I’m very happy to announce a very early cut of a node.js library for accessing Hadoop’s filesystem: node-hdfs. This is down to a lot of work from a colleague of mine: Horaci Cuevas.

A few months ago I was tinkering with the idea of building a Syslog to HDFS bridge: I wanted an easy way to forward web log (and other interesting data) straight out to HDFS. Given I’d not done much with node.js I thought it might be a fun exercise.

During about a week of very late nights and early mornings I followed CloudKick’s example to wrap Hadoop’s libhdfs and got as far as it reading and writing files. Horaci has picked the ball up and run far and wide with it.

After you’ve run node-waf configure && node-waf build you can write directly to HDFS:

There’s some more information in the project’s README.

Once again, massive thanks to Horaci for putting so much into the library; forks and patches most certainly welcome, I’m pretty sure the v8 C++ I wrote is wrong somehow!

]]>
Paul Ingles
tag:oobaloo.co.uk,2013:Post/85112 2011-09-01T07:51:00Z 2024-04-01T08:14:22Z Introducing clj-esper: simple Esper wrapper for Clojure

clj-esper is a very-early-stages Clojure library to wrap Esper, a complex event processing engine.

I’ve been working on building a simple systems monitoring tool over the past few weeks. The aim of this system is to capture events from various streams, provide a visualisation of how things are ‘now’ and (going forward) provide more intelligent error reporting. We’ve been using it to track success/error request rates and will be looking to fold in more event streams from inside our systems.

There’s a little info in the project’s README.md and some more in the tests, but here’s a high-level example from our monitoring app.

Esper events are modeled in clj-esper as regular maps (albeit with some metadata), and can be created with the defevent macro. The new-event function constructs a map with all fields defined (and with their values coerced- although these mappings are a little incomplete currently, they do enough for me :).

I had originally started an implementation based around defrecord and building classes but this started to become increasingly more complex so this seemed like a reasonable compromise. It’s probably not the cleanest but works ok for now.

TODO

I’m writing this (and publishing the code) because I’d really like to do a couple of things:

  • Esper allows events to contain other maps and complex types. It’d be great to add support for this.
  • Try an alternate modeling of the output event stream as a Clojure sequence (rather than the current callback function).

I’m sure there’s also a fair bit of the code that could be tidied and improved. I’d welcome any forks and pull requests of the clj-esper GitHub repository.

Hiring

We (Forward) are hiring great developers; if you’re interested then please feel free to check out our jobs page or ping me an email for more info.

]]>
Paul Ingles
tag:oobaloo.co.uk,2013:Post/85114 2011-08-25T10:48:00Z 2024-04-01T08:14:20Z Clojure, Abstraction and ZeroMQ

For me, the stand-out talk when I attended clojure-conj last year was Mark McGranaghan’s talk on Ring: “One Ring to Bind Them”. I’ve been working with ZeroMQ and Clojure these past few weeks and it’s been all the better because of Mark’s talk.

Core Abstractions

Mark’s talk deftly highlights the beauty of some of Clojure’s core abstractions, sequences and functions, and how Ring modeled it’s world around them. The following quote is from Alan Perlis and often used when talking about Clojure:

It’s better to have 100 functions operate on one data structure than to have 10 functions operate on 10 data structures

Building upon Clojure’s core abstractions makes it easy to compose new functionality from existing libraries. For example, Ring uses the concept of middleware- optional building blocks that decorate your application with additional behaviour. Because the core request handler is just a function, it’s possible to re-use Clojure’s threading macro to build up more complex behaviour:

The main-routes Var is built using Compojure, this is then wrapped by middleware to handle logging, exception handling and nested query parameters.

Of course, many other languages and libraries solve the problem in a similar way- the Java web frameworks I used to work with would most likely wrap this kind of stuff in via. an AOP framework that’s wired in with some IoC container like Spring.

What makes Clojure different, apart from not needing any more frameworks, is that it’s using such a core, language-level abstraction: there’s no need to write middleware adapters to join disparate things together.

ZeroMQ

I mentioned that it had been my working with ZeroMQ that reminded me of all of this. I’m working on wiring Esper into our production environment so that we can monitor the behaviour of our system better.

Much like Luca described in his talk, Node.js and ZeroMQ, I’m using Node.js and ZeroMQ as a kind of glue- tailing logs and other bits of information and re-publishing. This is then be aggregated and consumed in one place.

Core Abstractions

There are two things we need to do with our ZeroMQ sockets:

  • Consume data (from an ‘infinite’ stream)
  • Publish data

Of course, it’s trivialised a little, but it’s largely all we need to do.

For consuming data in Clojure, my first cut was fairly traditional- start a (while true) infinite loop that consumed messages and called out to a handler function. It looked a little like this:

It worked, but it’s pretty ugly and certainly not simple. Given it’s just calling a handler it’s also impossible to connect this to much around the rest of Clojure’s libraries without some work. Time to re-think.

Going back to our original statement of what we need to do with our sockets it’s possible to see there are some basic building blocks we could use:

Utility Clojure Type
Consume data (from an ‘infinite’ stream) Sequence
Publish data Function

Our compound consumer above can be re-written and turned into a sequence with repeatedly as follows:

Note how much cleaner the consumer code now is, and how we can re-use any of Clojure’s sequence functions to operate on the stream.

For our publisher we can write a function which returns a function:

The generated function closes over the initialised socket so that any consumer that wants to publish data can do so by just calling the function passing the bytes to be sent. It provides a clean interface and has the added advantage we can use it with many higher-order functions.

For me, this has really highlighted the power of Clojure over other JVM based languages- clean, simple, core abstractions that can be composed in simple, powerful ways.

Incidentally, I’m working on tidying up the code that interacts with both ZeroMQ and Esper. When they’re a little tidier I’ll open-source them and publish on my GitHub account, and most likely post an article or two here too. Stay tuned!

]]>
Paul Ingles
tag:oobaloo.co.uk,2013:Post/85115 2011-08-01T08:37:00Z 2024-04-01T08:10:53Z Introducing Clojure to an Organisation

A thread came up on the london-clojurians mailing list about people using Clojure in London. I replied about our use at Forward and below are the answers I gave to some questions Bruce asked.

How did we introduce Clojure?

I guess much like anything we use, we didn’t really introduce it. We experimented with it, used it to build some internal tools and systems. These would be rolled into production and we’d start getting a feel for where it might/might not be useful.

We’ve favoured building systems in small, independent pieces which makes swapping out an implementation easier, and encourages us to learn and re-learn everything about what that piece did. We’d take the knowledge but feel confident about dropping any/all of the code that ran before.

I used it originally at the beginning of last year for doing some work with Google’s APIs and to build a system to run the ETL flow for one of our businesses. A part of that runs on Hadoop (we have some tens-of-gigabyte XML files) and is still used today, although we dropped the flow system for a JRuby implementation.

More recently, we’ve been working at uSwitch to replace a monolithic .NET system (it’s actually lots of WCF services, but feels like you can’t manoeuvre easily :) with a mix of Ruby and Clojure. A colleague, Mike Jones, was on paternity leave and felt Clojure might be a good fit for the core pricing/comparison of the Utilities. As we went we uncovered all kinds of nuances and things which had been missed in the original .NET, and our Ruby implementation.

How did we get other people involved?

Anyone that worked on the team would need to do some work on the code at some point. Mike has kind of been the lead for it, but, all of us have been working with it.

We place a big emphasis on learning. We started studying SICP and organising weekly meetings to go through examples. Others started working through the Project Euler questions and meeting to go through those.

What have been the biggest problems?

I think it’s been getting the functional-feel/Clojure-feel. After a while you get a feel for what’s good/bad with OO languages- forced out through many years of TDDing and applying OO principles to older systems. I don’t think any of us had experience with a functional language, so you have to rely on more base things to know whether it’s going well. I’d say more recently, I take a lot of inspiration from Stuart Halloway’s emphasis on Simple over Compound to know where a solution lies.

I’d say it’s taken us a long time and lots of extra learning to get to being average Clojure programmers. But, I definitely think it’s made us significantly better programmers overall (a side-effect of learning SICP and some other old-school CompSci books has been making better decisions). It sets the programmer bar pretty high.

What have been the biggest successes?

I actually think one of Clojure’s best strengths is it’s Java Interop. If I’m looking at using some Java library, I’ll almost always ‘lein new’ a new project and play around. I find the flow in Emacs/SLIME with Clojure very productive now. I also think the interop code you write ends up being cleaner than with other JVM languages (think JRuby).

The bit of code I wrote at the beginning of last year to do some of our big data ETL is still being used (although given it’s triviality it’s more to do with it just working, than a specific Clojure #win :). The utilities pricing has probably been in production for around 9 months and runs really well. We hired Antonio Garrote, who slated our Clojure code during his interview :), and he’s been using Incanter to help analyse and visualise some stuff he’s been doing with Mahout.

Aside from anything Clojure specific, I think the biggest success has been the emphasis it’s placed on us to be more thoughtful and analytical programmers.

Any surprises?

This isn’t really related to Clojure per se, but, Mike and I both attended clojure-conj last year. During the flight we paired for about 7 hours and rewrote whole parts of the utilities code. Protocols had just been introduced to Clojure and we thought it might be possible to write a tidier implementation. We added them and then deleted them, our implementation didn’t really work out very well. But, what was surprising was how being locked away without the Internet was still productive. We felt it was one of the most productive 7 hours work we’ve ever had.

]]>
Paul Ingles
tag:oobaloo.co.uk,2013:Post/85116 2011-07-27T12:13:00Z 2024-04-01T08:14:00Z Cocoa-ified Emacs Fullscreen in OSX Lion

I’ve got a mostly working patch for Homebrew’s Emacs recipe that will build Emacs with a Cocoa interface that supports OSX Lion’s new full-screen mode. I’m posting here so someone else can beat me to it. I know Emacs already has full-screen, this was definitely an exercise in yak-shaving.

It doesn’t quite fill the screen (there’s still some weird height/width calculation bits in EmacsWindow I’ve not gotten my head around yet). It also messes up the screen size when you move back out of full-screen mode.

The following gist includes the full emacs.rb recipe (which adds a command to patch with the above diff).

]]>
Paul Ingles
tag:oobaloo.co.uk,2013:Post/85117 2011-06-15T08:27:00Z 2024-04-01T08:11:36Z Dynamic error capture with Clojure

I’ve recently been trying to improve parts of uSwitch.com’s Clojure pricing code for the last few days. Mostly this has been to add error handling that provides a form of graceful degradation.

The majority of the application deals with pricing the various consumer Energy plans that people can pick from. Although we try and make sure everything validates before it hits the site we’ve found a few weird problems that weren’t anticipated. This can be bad when errors prevent the other results from being returned successfully.

Ideally, we’d like to be able to capture both the errors and the plans we couldn’t price; clients can use the data we have and know what’s missing.

I’m sure I had read an interview in which Rich Hickey said how Clojure’s dynamism helped deal with error handling in a clean and safe way. I can’t find a reference (so it’s possible I made that up), but, I then was looking through The Joy of Clojure and found this:

“there are two directions for handling errors. The first … refers to the passive handling of exceptions bubbling outward from inner functions. But built on Clojure’s dynamic Var binding is a more active mode of error handling, where handlers are pushed into inner functions.”

The code below shows a trivialised version of the problem- a calculation function that might raise an error part-way through the collection.

Instead, we can use binding and an error handling function to dynamically handle the problem and push this down the stack.

Note that we’re using declare to define our error-handler Var, and, that we have to mark it as :dynamic as we’re going to be dynamically binding it.

The next stage is to progress from just returning nil and to capture the errors whilst the records are being processed. We can use Atoms to hold the state and then append more information as we flow through.

The above example introduces an errors atom that will capture the responses as we map across the sequence. But it definitely now feels a little icky.

  1. We use do to both add the error to our list of errors, and return nil.
  2. Because we’ve now introduced side-effects we must use doall to realise the sequence whilst the handle-error function is rebound.

I have to say, I’m not too sure whether I prefer this more dynamic approach or a more traditional try...catch form.

The dynamic behaviour is definitely very cool, and the authors of The Joy of Clojure say that “using dynamic scope via binding is the preferred way to handle recoverable errors in a context-sensitive manner.” so I’m very inclined to stick with it. However, I think I’ve managed to make it less nice: what originally looked like a neat use of closure to capture errors in a safe way now seems less good? I’d love to hear what more experienced Clojurists make of it.

Other references:

  1. http://kotka.de/blog/2010/05/Didyouknow_IV.html
  2. http://kotka.de/blog/2009/11/TamingtheBound_Seq.html
  3. http://cemerick.com/2009/11/03/be-mindful-of-clojures-binding/
]]>
Paul Ingles
tag:oobaloo.co.uk,2013:Post/85118 2011-05-10T12:49:00Z 2024-04-01T07:21:00Z Using partial to tidy Clojure tests

I was reading through getwoven’s infer code on GitHub and noticed a nice use of partial to tidy tests.

Frequently there’ll be a function under test that will be provided multiple inputs with perhaps only a single parameter value changing per example. Using partial you can build a function that closes over it’s variable arguments letting you tidy up the call to the single (varying) parameter.

The example I found was in infer’s sparse_classification_test.clj but I’ve written a quick gist to demonstrate the point:

]]>
Paul Ingles
tag:oobaloo.co.uk,2013:Post/85119 2011-05-05T22:40:00Z 2024-04-01T07:21:01Z Recognising SSL Requests in Rack with Custom Headers

For a while now I’ve been working on replacing bits of uSwitch.com’s .NET heritage with some new Clojure and Ruby blood. A problem with one of the new applications came up when we needed it to recognise (and behave differently) when an SSL secured request was made because of non-standard headers (although I’m yet to successfully Google the RFC where HTTP_X_FORWARDED_PROTO is defined :).

Polyglot Deployment

New applications are deployed on different machines but proxied by the old application servers- letting us mount new applications inside the current website. Although the servers run IIS and ASP.NET they’re configured much like nginx’s proxy_pass module (for example). You set the matching URL and the URL you’d like to proxy to. uSwitch.com also use hardware load balancers in front of the application and web servers.

Rack Scheme Detection

Recent releases of Rack include a ssl? method on the Request that return true if the request is secure. This, internally, calls scheme to check whether any of the HTTP headers that specify an HTTPS scheme are set (the snippet from Rack’s current code is below).

Unfortunately, this didn’t recognise our requests as being secure. The hardware load-balancer was setting a custom header that wasn’t anything Rack would expect. The quickest (and perhaps dirty?) solution- a gem, rack-scheme-detect, that allows additional mappings to be provided- the rest of Rack will continue to work (and all of the other middleware and apps above it).

The following snippet shows how it can be used inside a classic Sinatra application to configure the additional mapping.

Of course we’ll be making sure we also set one of the standard headers. But, for anyone who needs a quick solution when that’s not immediately possible, hopefully rack-scheme-detect might save some time.

]]>
Paul Ingles
tag:oobaloo.co.uk,2013:Post/85120 2011-05-04T11:59:00Z 2024-04-01T08:13:42Z Multiple connections with Hive

We’ve been using Hadoop and Hive at Forward for just over a year now. We have lots of batch jobs written in Ruby (using our Mandy library) and a couple in Clojure (using my fork of cascading-clojure). This post covers a little of how things hang together following a discussion on the Hive mailing list around opening multiple connections to the Hive service.

Hive has some internal thread safety problems (see HIVE-80) that meant we had to do something a little boutique with HAProxy given our usage. This article covers a little about how Hive fits into some of our batch and ad-hoc processing and how we put it under HAProxy.

Background

Hive is used for both programmatic jobs and interactively by analysts. Interactive queries come via a web-based product, called CardWall, that was built for our search agency. In both cases, behind the scenes, we have another application that handles scheduling jobs, retrying when things fail (and alerting if it’s unlikely to work thereafter).

Batch Scheduling

Internally, this is how things (roughly) look:

Batch processing

The Scheduler is responsible for knowing which jobs need to run and queuing work items. Within the batch processing application an Agent will pick up an item and check whether it’s dependencies are available (we use this to integrate with all kinds of other reporting systems, FTP sites etc.). If things aren’t ready it will place the item back on the queue with a delay (we use Beanstalkd which makes this all very easy).

Enter Hive

You’ll notice from the first screenshot we have some Hive jobs that are queued. When we first started using Hive we started using a single instance of the HiveServer service started as follows: $HIVE_HOME/bin/hive --service hiveserver. Mostly this was using a Ruby Gem called RBHive.

This worked fine when we were using it with a single connection, but, we ran into trouble when writing apps that would connect to Hive as part of our batch processing system.

Originally there was no job affinity, workers would pick up any piece of work and attempt it, and with nearly 20 workers this could heavily load the Hive server. Over time we introduced different queues to handle different jobs, allowing us to allocate a chunk of agents to sensitive resources (like Hive connections).

Multiple Hive Servers

We have a couple of machines that run multiple HiveServer instances. We use Upstart to manage these processes (so have hive1.conf, hive2.conf… in our /etc/init directory). Each config file specifies a port to open the service on (10001 in the example below).

These are then load-balanced with HAProxy, the config file we use for that is below

]]>
Paul Ingles
tag:oobaloo.co.uk,2013:Post/85121 2011-04-18T19:54:00Z 2024-04-01T08:01:39Z Using Clojure Protocols for Java Interop

Clojure's protocols were a feature I'd not used much of until I started working on a little pet project: clj-hector (a library for accessing the Cassandra datastore).

Protocols provide a means for attaching type-based polymorphic functions to types. In that regard they're somewhat similar to Java's interfaces (indeed Java can interoperate with Clojure through the protocol-generated types although it's not something I've tried). Here's the example of their use from the Clojure website:

Protocols go deeper though: they can be used with already defined types (think attaching behaviour through mixing modules into objects with Ruby's include). It's for this reason that they've been a particularly nice abstraction for building adapters upon: glue that translates Java objects to Clojure structures when doing interop.

Here's a snippet from a bit of the code that converts Hector query results into maps:

QueryResultImpl contains results for queries. In one instance, this is RowsImpl which contains Row results (which in turn are converted by other parts of the extend-protocol statement in the real code). The really cool part of this is that dispatch happens polymorphically: there's no need to write code to check types, dispatch (and call recursively down the tree). Instead, you map declaratively by type and build a set of statements about how to convert. Clojure does the rest.

Pretty neat.

]]>
Paul Ingles
tag:oobaloo.co.uk,2013:Post/84979 2011-04-17T11:35:00Z 2024-04-01T07:54:26Z Processing null character terminated text files in Hadoop with a NullByteTextInputFormat

It was Forward's first hackday last Friday. Tom Hall and I worked on some collaborative filtering using Mahout and Hadoop to process some data collected from Twitter.

I'd been collecting statuses through their streaming API (using some code from a project called Twidoop). After wrestling with formats for a little while we realised that each JSON record was separated by a null character (all bits zeroed). There didn't seem to be an easy way to change the terminating character for the TextInputFormat that we'd normally use so we wrote our own InputFormat and I'm posting it here for future reference (and anyone else looking for a Hadoop InputFormat to process similar files).

We added it to my fork of cascading-clojure but it will work in isolation.

]]>
Paul Ingles